What is R?
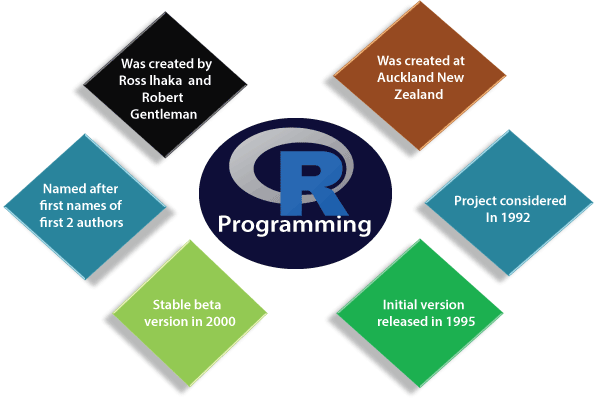
R is a programming language and open-source software environment specifically designed for statistical computing, data analysis, and graphical visualization. It was developed by Robert Gentleman and Ross Ihak in the early 1990s at the University of Auckland, New Zealand. R has gained popularity due to its extensive statistical and graphical capabilities, along with its vibrant community that contributes a wide range of packages and extensions.
Top Use Cases of R:
- Data Analysis: R is widely used for exploring and analyzing large datasets, performing descriptive statistics, and deriving insights from data.
- Statistical Modeling: R is used for building and fitting various statistical models, including linear and nonlinear regression, time series analysis, and machine learning algorithms.
- Data Visualization: R provides powerful tools for creating a wide range of visualizations, such as scatter plots, bar charts, heatmaps, and interactive graphics.
- Bioinformatics: R is commonly used in bioinformatics for processing and analyzing biological data, such as DNA sequencing data.
- Econometrics: R is used in economics to analyze economic data, estimate economic models, and conduct econometric research.
- Social Sciences: R is applied in fields like psychology, sociology, and political science for analyzing survey data and conducting social research.
- Environmental Science: R is used to analyze environmental data, model ecosystems, and simulate environmental scenarios.
- Finance: R is utilized for financial data analysis, risk assessment, portfolio optimization, and quantitative modeling.
- Machine Learning: R has a variety of machine learning packages that enable building and evaluating machine learning models.
- Data Mining: R is used for extracting meaningful patterns and information from large datasets through techniques like clustering and association rule mining.
What are the features of R?
- Data Manipulation: R offers a wide range of functions for data manipulation, transformation, and cleaning.
- Statistical Analysis: R provides a comprehensive set of statistical tools for hypothesis testing, probability distributions, and regression analysis.
- Data Visualization: R includes packages for creating static and interactive visualizations that facilitate data exploration and presentation.
- Extensible: R’s package system allows users to extend its functionality by installing and using various packages contributed by the community.
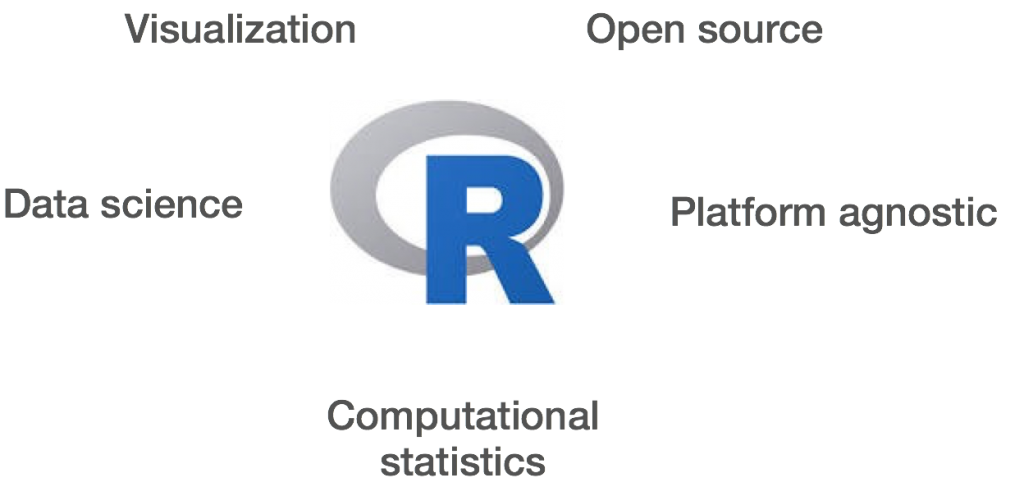
- Open Source: R is open-source software, which means it’s freely available for anyone to use, modify, and distribute.
- Data Import/Export: R supports various data formats, including CSV, Excel, JSON, and databases, making it versatile for handling different data sources.
- Community and Support: R has a large and active community, leading to a wealth of online resources, tutorials, and forums.
- Reproducibility: R enables reproducible research by providing tools to document, share, and reproduce analysis workflows.
What is the workflow of R?
- Data Import: Load data from various sources into R using functions like
read.csv,read_excel, etc. - Data Exploration: Perform initial data exploration to understand the structure, quality, and distribution of the data.
- Data Preprocessing: Clean and preprocess the data by handling missing values, outliers, and transforming variables.
- Statistical Analysis: Apply statistical tests and models to derive insights from the data.
- Data Visualization: Create visualizations to understand patterns, relationships, and trends within the data.
- Model Building: Construct statistical or machine learning models to make predictions or identify patterns.
- Model Evaluation: Assess the performance of models using appropriate metrics and validation techniques.
- Reporting: Document the analysis process, results, and visualizations to communicate findings effectively.
How R Works & Architecture?
R is an interpreted language, which means that the code is executed line by line by an interpreter. It operates through a command-line interface (CLI) or integrated development environments (IDEs) like RStudio. R has a diverse set of built-in functions, and its real power comes from the extensive collection of packages that provide specialized functions for various tasks. These packages are written in R or other programming languages and are loaded into R’s environment as needed.
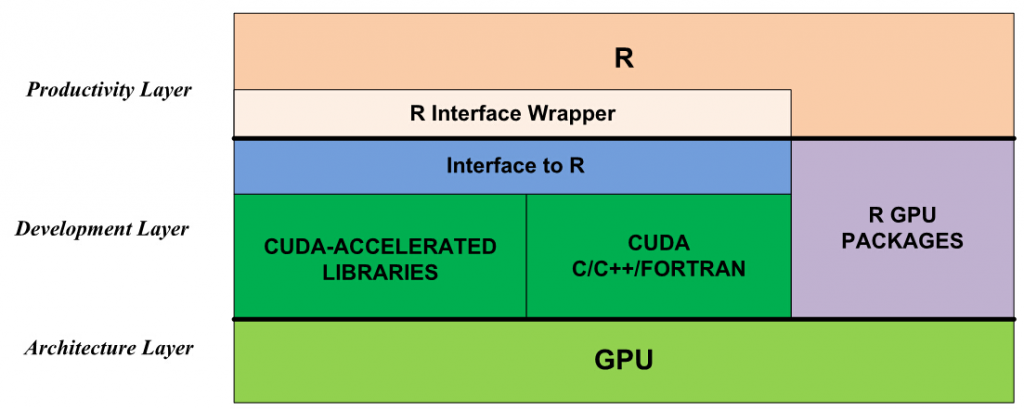
R’s architecture involves the following components:
- R Core System: The core system includes the basic functions and data structures of the R language.
- Packages: Additional functionality is added through packages. Packages can be developed by the R community or by individuals to address specific needs.
- Environment: R maintains an environment where variables, functions, and packages are stored during a session.
- Workspace: The workspace contains the current objects, data, and functions loaded into memory.
- Graphics Device: R provides various graphics devices for creating plots and visualizations.
How to Install and Configure R?
To install and configure R, follow these steps:
- Download R: Go to the official R website (https://cran.r-project.org/mirrors.html) and choose a CRAN mirror site to download R for your operating system.
- Install R: Run the installer and follow the installation instructions. Make sure to select the appropriate options for your system.
- Install RStudio (Optional but Recommended): RStudio is a popular integrated development environment (IDE) for R. Download and install RStudio from https://www.rstudio.com/products/rstudio/download/.
- Start R or RStudio: After installation, launch R or RStudio.
- Install Packages: Install packages using the
install.packages("package_name")function. For example, to install theggplot2package for data visualization, runinstall.packages("ggplot2"). - Load Packages: Once installed, load a package using the
library(package_name)function. For example, to load theggplot2package, runlibrary(ggplot2). - Configuration: R’s default configuration is usually sufficient for most users. However, you can customize settings by creating a
.Rprofilefile in your home directory.
Remember that the installation and configuration process may vary slightly depending on your operating system. It’s recommended to refer to the official R and RStudio documentation for detailed instructions.
Fundamental Tutorials of R: Getting Started Step by Step
Certainly! Here’s a step-by-step tutorial covering some fundamental concepts and tasks in R:

Step 1: Installation and Setup:
- Download and install R from the official CRAN website: https://cran.r-project.org/mirrors.html
- (Optional but recommended) Download and install RStudio from: https://www.rstudio.com/products/rstudio/download/
- Open R or RStudio to start coding.
Step 2: Basics of R:
- R Console: R operates through a console where you can type and execute commands.
- Arithmetic Operations:
   5 + 3      # Addition
   10 - 4     # Subtraction
   3 * 6      # Multiplication
8 / 2 # DivisionCode language: PHP (php)- Variables:
   x <- 10    # Assign a value to a variable
y <- x + 5 # Perform operations with variablesCode language: PHP (php)- Data Types:
   num <- 42       # Numeric
   text <- "Hello" # Character
   logic <- TRUE   # Logical (TRUE/FALSE)Code language: PHP (php)
Step 3: Working with Data:
- Vectors:
   numeric_vector <- c(2.5, 6.8, 3.2)
character_vector <- c("apple", "banana", "orange")Code language: JavaScript (javascript)- Indexing and Slicing:
   numeric_vector[1]       # Access element at index 1
   character_vector[2]     # Access element at index 2
numeric_vector[2:3] # Access elements 2 to 3Code language: CSS (css)- Data Frames:
   # Create a data frame
   data <- data.frame(Name = c("Alice", "Bob", "Carol"),
                      Age = c(25, 30, 28))

   # Access data frame columns
   data$Name
   data$AgeCode language: PHP (php)
Step 4: Data Manipulation:
- Basic Functions:
   length(numeric_vector)    # Length of vector
   mean(numeric_vector)      # Mean of vector
max(numeric_vector) # Maximum valueCode language: PHP (php)- Filtering Data:
filtered_data <- data[data$Age > 28, ] # Select rows where Age > 28Code language: PHP (php)- Adding Columns:
data$Gender <- c("F", "M", "F") # Add a new column 'Gender'Code language: PHP (php)Step 5: Data Visualization:
- Install and Load ggplot2:
   install.packages("ggplot2")
library(ggplot2)Code language: JavaScript (javascript)- Create a Scatter Plot:
   ggplot(data, aes(x = Age, y = Height)) +
     geom_point() +
     labs(title = "Age vs. Height", x = "Age", y = "Height")Code language: JavaScript (javascript)
Step 6: Basic Statistical Analysis:
- Summary Statistics:
summary(numeric_vector) # Basic statisticsCode language: PHP (php)- Linear Regression:
   model <- lm(Y ~ X, data = dataset)   # Create a linear regression model
   summary(model)                      # View model summaryCode language: PHP (php)
Step 7: Reproducible Scripts:
- Creating a Script:
Open a new R script in RStudio. - Write Code:
Write the code for your analysis in the script. - Run Code:
Select and run lines of code using Ctrl + Enter or run the entire script. - Saving Scripts:
Save the script with a.Rextension.
This tutorial covers the basics of R, from installation to performing basic data manipulation and visualization tasks. As you become more comfortable with these concepts, you can explore more advanced topics like loops, functions, statistical modeling, and machine learning using R. Remember to refer to R documentation and online resources for further learning.

👤 About the Author
Ashwani is passionate about DevOps, DevSecOps, SRE, MLOps, and AiOps, with a strong drive to simplify and scale modern IT operations. Through continuous learning and sharing, Ashwani helps organizations and engineers adopt best practices for automation, security, reliability, and AI-driven operations.
🌐 Connect & Follow:
- Website: WizBrand.com
- Facebook: facebook.com/DevOpsSchool
- X (Twitter): x.com/DevOpsSchools
- LinkedIn: linkedin.com/company/devopsschool
- YouTube: youtube.com/@TheDevOpsSchool
- Instagram: instagram.com/devopsschool
- Quora: devopsschool.quora.com
- Email– contact@devopsschool.com
Find Trusted Cardiac Hospitals
Compare heart hospitals by city and services — all in one place.
Explore Hospitals