What is TIBCO Spotfire?
TIBCO Spotfire is a data visualization and analytics platform developed by TIBCO Software. It enables organizations to analyze and visualize data from various sources, facilitating data-driven decision-making and insights discovery. Spotfire provides advanced analytics capabilities along with interactive dashboards and visualizations.
Top 10 use cases of TIBCO Spotfire:
Here are the top 10 use cases of TIBCO Spotfire:
- Data Visualization: Spotfire offers a wide range of visualization options, including charts, graphs, maps, and scatter plots, helping users understand complex data patterns and relationships.
- Data Exploration: Users can explore data through interactive features like filtering, drilling down, and hierarchies, enabling them to uncover insights and trends within their datasets.
- Self-Service Analytics: Spotfire empowers business users to perform ad-hoc analyses, create visualizations, and build reports without relying on IT teams.
- Predictive Analytics: Spotfire integrates with TIBCO Data Science to apply advanced predictive modeling and machine learning algorithms to data, enabling forecasting and trend analysis.
- Data Blending: Spotfire allows users to blend data from various sources, combining disparate datasets for comprehensive analysis.
- Geospatial Analytics: Organizations can analyze location-based data and create interactive maps to visualize spatial relationships and patterns.
- Operational Dashboards: Spotfire enables the creation of real-time operational dashboards that monitor key metrics and provide insights into business processes.
- Statistical Analysis: Spotfire provides statistical tools for analyzing data distributions, performing hypothesis testing, and conducting data-driven decision-making.
- Time Series Analysis: Users can analyze time-based data to identify trends, seasonal patterns, and anomalies, facilitating time series forecasting.
- Life Sciences Research: Spotfire is commonly used in the pharmaceutical and biotech industries for data analysis in drug discovery, clinical trials, and research.
- Supply Chain Optimization: Organizations can analyze supply chain data to optimize inventory management, reduce costs, and enhance logistics.
These use cases illustrate the versatility of TIBCO Spotfire in helping organizations extract insights from data, optimize operations, and improve decision-making across various industries and business functions.
What are the feature of TIBCO Spotfire?
TIBCO Spotfire is a feature-rich data visualization and analytics platform that offers a variety of tools to analyze, visualize, and gain insights from data. It provides capabilities for data exploration, advanced analytics, and interactive dashboards. Here are some key features of TIBCO Spotfire:
- Data Connectivity: TIBCO Spotfire supports connectivity to a wide range of data sources, including databases, spreadsheets, cloud services, and big data platforms.
- Data Preparation and Transformation: Users can perform data transformation, cleansing, and enrichment using intuitive interfaces. Data preparation tools help in handling dirty, incomplete, or inconsistent data.
- Data Exploration: TIBCO Spotfire offers interactive data exploration features, including filtering, sorting, and drilling down, to uncover patterns, trends, and insights within datasets.
- Visualizations: The platform provides a variety of visualization options such as scatter plots, bar charts, line charts, maps, and more. Users can customize the visual appearance and properties.
- Predictive Analytics: TIBCO Spotfire integrates with TIBCO Data Science to enable predictive analytics and machine learning, allowing users to build and deploy predictive models.
- Advanced Analytics: Users can perform statistical analyses, hypothesis testing, regression, clustering, and other advanced analytics operations on their data.
- Data Blending: TIBCO Spotfire supports data blending and joins, allowing users to combine data from multiple sources for comprehensive analysis.
- Dashboard Creation: Users can create interactive dashboards by combining multiple visualizations, filters, and elements into a single view. Interactivity enables real-time exploration.
- Storytelling: TIBCO Spotfire supports data storytelling, allowing users to create narratives by combining visualizations, annotations, and insights in a structured format.
- Collaboration and Sharing: Users can collaborate on analyses by sharing visualizations, dashboards, and insights with colleagues. Shared content can be accessed through the web interface.
- Mobile Accessibility: TIBCO Spotfire offers mobile access, enabling users to view and interact with visualizations and dashboards on smartphones and tablets.
How TIBCO Spotfire works and Architecture?
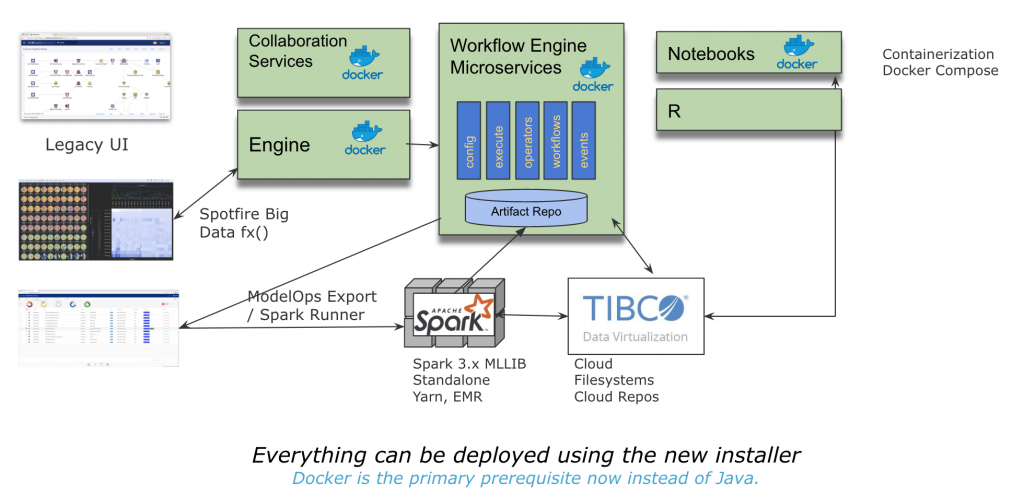
TIBCO Spotfire’s architecture is designed to provide a scalable and efficient platform for data analysis and visualization. Here’s an overview of its architecture:
- Data Sources: TIBCO Spotfire connects to various data sources through data connectors, allowing users to access and import data for analysis.
- Data Preparation: Users can prepare data using Spotfire’s data preparation tools, which involve data transformation, cleansing, and enrichment.
- Data Exploration: Users interact with data by creating visualizations, applying filters, and exploring insights within the Spotfire interface.
- Visualizations and Dashboards: Visualizations are generated based on user selections and interactions. Dashboards are composed of multiple visualizations and interactive elements.
- Advanced Analytics Integration: For advanced analytics and predictive modeling, Spotfire integrates with TIBCO Data Science or other external analytics platforms.
- Collaboration and Sharing: Users can share visualizations, dashboards, and analyses with colleagues and stakeholders. Shared content is accessible through web browsers.
- Mobile Access: Spotfire supports mobile devices through responsive design or dedicated mobile applications, enabling users to access data insights on the go.
- Backend Services: Backend services handle user actions, data processing, query generation, and data visualization rendering.
- Security and Authentication: Spotfire provides security features to ensure data protection, role-based access, and user authentication.
TIBCO Spotfire’s architecture aims to provide an intuitive, interactive, and flexible environment for users to explore and analyze data, make informed decisions, and share insights with their teams and stakeholders.
How to Install TIBCO Spotfire?
To install TIBCO Spotfire, you can either use the TIBCO Spotfire installer or the TIBCO Spotfire virtual appliance.
Using the TIBCO Spotfire installer
- Go to the TIBCO website and download the TIBCO Spotfire installer for your operating system.
- Run the installer and apply the instructions over the live screen.
- On the first screen, agree to the terms of the license agreement and choose Next.
- On the second screen, select the installation options that you want and click Next.
- On the third screen, select the folder where you want to install TIBCO Spotfire and click Install.
- The installer will start installing TIBCO Spotfire. This may take a few minutes.
- Once the installation is complete, click Finish.
Using the TIBCO Spotfire virtual appliance
- Go to the TIBCO website and create a TIBCO account.
- Subscribe to TIBCO Spotfire.
- Once you have subscribed to TIBCO Spotfire, you will be able to download the TIBCO Spotfire virtual appliance.
Once you have downloaded the TIBCO Spotfire virtual appliance, follow these steps to install it:
- Unzip the TIBCO Spotfire virtual appliance file.
- Open the VirtualBox application.
- Hit on the File menu and choose Import Appliance….
- In the Import Appliance dialog box, select the TIBCO Spotfire virtual appliance file that you unzipped in step 1.
- Click on the Open button.
- The TIBCO Spotfire virtual appliance will be imported into VirtualBox.
- Click on the Start button to start the TIBCO Spotfire virtual appliance.
- The TIBCO Spotfire virtual appliance will start up and you will be prompted to log in.
- Log in using the username and password that you created when you subscribed to TIBCO Spotfire.
- Once you have logged in, you will be able to access TIBCO Spotfire.
Basic Tutorials of TIBCO Spotfire: Getting Started

The following are the step-by-step basic tutorials of TIBCO Spotfire:
Getting Started with Spotfire
- Download and install the Spotfire client software. You may download the software from their official website.
- Create a new Spotfire project. To do this, open the Spotfire client software and click on the “New Project” button.
- Connect to a data source. Spotfire can connect to a variety of data sources, including spreadsheets, databases, and cloud-based data warehouses. To connect to a data source, click on the “Data” tab and then click on the “Connect to Data” button.
- Create a visualization. Once you have connected to a data source, you can start creating visualizations. To create a visualization, drag and drop fields from the data source onto the canvas.
- Share your insights. Once you have created a visualization, you can share it with others by exporting it to a variety of formats, such as PDF, PNG, or HTML. You can also share it by embedding it in a web page or blog post.
Here are the steps involved in more detail:
- Download and install the Spotfire client software.
- Go to the TIBCO website and download the Spotfire client software for your operating system.
- Once the download is complete, run the installer to install the software.
- Create a new Spotfire project.
- Open the Spotfire client software.
- Hit on the “File” menu and choose “New Project”.
- In the “New Project” dialog box, enter a name for your project and click on the “Create” button.
- Connect to a data source.
- In the Spotfire client software, click on the “Data” tab.
- In the “Data” tab, hit on the “Connect to Data” button.
- In the “Connect to Data” dialog box, select the type of data source that you want to connect to.
- For example, if you want to connect to a spreadsheet, select the “Excel” option.
- Enter the connection information for your data source and click on the “Connect” button.
- Create a visualization.
- You may start creating visualizations after, Once you have connected to a data source.
- To create a visualization, drag and drop fields from the data source onto the canvas.
- For example, if you want to create a bar chart, drag the “Product Name” field and the “Sales” field onto the canvas.
- Spotfire will automatically create a bar chart that shows the sales for each product.
- Share your insights.
- Once you have created a visualization, you can share it with others by exporting it to a variety of formats, such as PDF, PNG, or HTML.
- You can also share it by embedding it in a web page or blog post.
- To export a visualization, click on the “File” menu and select “Export”.
- In the “Export” dialog box, select the format that you want to export the visualization to and click on the “Export” button.
Intro to Visualizations
- Learn about the different types of visualizations that can be created in Spotfire. Spotfire offers a wide range of visualizations, including charts, maps, and dashboards.
- Customize visualizations to fit your needs. You can customize visualizations by changing the colors, fonts, and other properties. You can also add filters and groupings to your visualizations to explore your data in more detail.
- Use filters and groupings to explore your data. Filters and groupings can be used to narrow down your data and focus on specific subsets. This can be helpful for identifying trends and patterns in your data.
- Create interactive visualizations. Spotfire visualizations can be interactive, which means that users can interact with them to explore the data in more detail. For example, users can click on a point on a chart to see more information about that point.
Here are some examples of the different types of visualizations that can be created in Spotfire:
- Charts are used to visualize data in a graphical way. Some common types of charts include bar charts, line charts, and pie charts.
- Maps are used to visualize data geographically. Spotfire can connect to a variety of map services, such as Google Maps and ArcGIS.
- Dashboards are a collection of visualizations that are displayed together on a single page. Dashboards can be used to provide a quick overview of your data.
Here are some tips for customizing visualizations in Spotfire:
- You can change the colors, fonts, and other properties of visualizations to make them look more appealing and easier to understand

👤 About the Author
Ashwani is passionate about DevOps, DevSecOps, SRE, MLOps, and AiOps, with a strong drive to simplify and scale modern IT operations. Through continuous learning and sharing, Ashwani helps organizations and engineers adopt best practices for automation, security, reliability, and AI-driven operations.
🌐 Connect & Follow:
- Website: WizBrand.com
- Facebook: facebook.com/DevOpsSchool
- X (Twitter): x.com/DevOpsSchools
- LinkedIn: linkedin.com/company/devopsschool
- YouTube: youtube.com/@TheDevOpsSchool
- Instagram: instagram.com/devopsschool
- Quora: devopsschool.quora.com
- Email– contact@devopsschool.com
Find Trusted Cardiac Hospitals
Compare heart hospitals by city and services — all in one place.
Explore Hospitals