What is UptimeRobot?
UptimeRobot is a free and powerful website monitoring service that lets you track the uptime and performance of your online assets. It acts as a watchful guardian, constantly checking your websites, servers, APIs, and other services to ensure they’re always up and running smoothly.
Top 10 use cases of UptimeRobot?
Here are the top 10 use cases of UptimeRobot:
1. Uptime Monitoring:
- Continuously monitor the availability of your website from multiple global locations, receiving instant alerts via email, SMS, or other channels if downtime occurs.
2. Performance Insights:
- Gain valuable insights into your website’s loading times, identify bottlenecks, and track key performance metrics like response times and resource usage.
3. Alerting and Notification:
- Set up custom alerts for critical metrics like uptime and page load times, ensuring you’re promptly notified of any potential issues.
4. Real User Monitoring (RUM):
- (Available in Pro plans) Understand how real users experience your website across different devices and locations, pinpointing issues affecting specific user segments.
5. Synthetic Monitoring:
- (Available in Pro plans) Simulate user interactions to proactively detect and troubleshoot performance issues before they impact real users.
6. Status Pages:
- (Available in Pro plans) Create and customize public status pages to transparently communicate website outages and maintenance activities to your users.
7. API Monitoring:
- Ensure the uptime and performance of your APIs, preventing disruptions to dependent applications.
8. Transaction Monitoring:
- (Available in Pro plans) Track the performance of specific user journeys on your website, like checkout processes or login forms, to ensure a seamless user experience.
9. Server Monitoring:
- (Available in Pro plans) Monitor the health and performance of your servers, tracking CPU, memory, disk usage, and other critical metrics.
10. Competitor Benchmarking:
- (Available in Pro plans) Compare your website’s performance against competitors to identify areas for improvement and stay ahead of the curve.
UptimeRobot offers a robust free plan with essential features like website monitoring, alerts, and basic reporting. Paid Pro plans unlock additional functionalities like RUM, synthetic monitoring, status pages, server monitoring, and competitor benchmarking.
Whether you’re a small business owner, a developer, or an IT professional, UptimeRobot provides a valuable tool to ensure your online assets are always performing at their best.
What are the feature of UptimeRobot?
UptimeRobot boasts a feature set catering to various website and service monitoring needs, with both free and paid tiers offering different functionalities. Here’s a breakdown of its key offerings:
Free Plan:
- Website Monitoring: Monitor up to 50 websites from multiple global locations.
- Uptime and Downtime Alerts: Receive instant notifications via email, SMS, or integrations for outages and recoveries.
- Customizable Alert Thresholds: Set thresholds for key metrics like uptime percentage and response times.
- Basic Reporting: Track historical uptime data and generate basic reports.
- Ping Monitoring: Check the availability of servers, networks, and other network devices.
- Port Monitoring: Monitor specific ports on your servers for uptime and connectivity.
- Keyword Monitoring: Verify the presence or absence of specific keywords on your website pages.
- SSL and Domain Expiration Monitoring: Get notified before your SSL certificates or domain names expire.
Pro Plan (Additional Features):
- Unlimited Monitors: Monitor as many websites, servers, and other services as needed.
- Real User Monitoring (RUM): Gain insights into real user experience from different locations and devices.
- Synthetic Monitoring: Simulate user interactions to proactively detect performance issues.
- Status Pages: Create and customize public status pages for transparent communication.
- API Monitoring: Monitor the uptime and performance of your APIs.
- Transaction Monitoring: Track specific user journeys on your website for smooth user experience.
- Server Monitoring: Monitor server health and performance metrics like CPU, memory, and disk usage.
- Competitor Benchmarking: Compare your website’s performance against competitors.
- Maintenance Windows: Pause monitoring during planned maintenance activities.
- Advanced Alerting and Reporting: Set up custom alert escalation chains and generate detailed reports.
- Integrations: Integrate with various tools like Slack, PagerDuty, and ticketing systems.
Choosing the Right Plan:
The free plan is ideal for basic website monitoring needs and small websites. Upgrading to a Pro plan unlocks advanced features and increased monitoring capacity for larger websites, critical services, and deeper performance insights
How UptimeRobot works and Architecture?
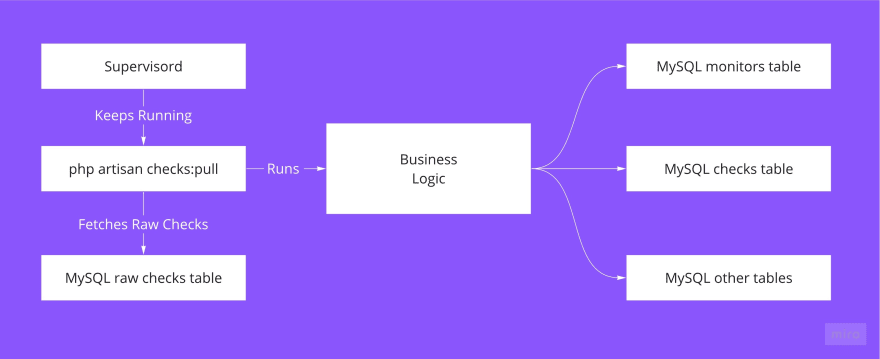
UptimeRobot’s architecture focuses on simplicity and reliability, ensuring constant website and service monitoring with minimal complexity. Here’s a breakdown of its key components and workflows:
1. Global Monitoring Network:
- A distributed network of probes strategically placed in data centers worldwide.
- These probes send periodic checks (pings, HTTP requests, etc.) to your designated websites, servers, and APIs.
- Geographical diversity ensures accurate monitoring regardless of user location and regional outages.
2. Data Collection and Analysis:
- Probe data is securely transmitted to UptimeRobot’s central servers for processing and analysis.
- Uptime, performance metrics, and response times are aggregated and analyzed to assess your monitored assets’ health.
- Real-time and historical data are stored for later viewing and reporting.
3. Alerting and Notification System:
- Customizable alert thresholds are set for critical metrics like uptime percentage, response times, and keyword presence/absence.
- When thresholds are breached, UptimeRobot triggers instant notifications via your chosen channels: email, SMS, webhooks, integrations with other tools like Slack or PagerDuty.
- This allows for immediate reaction to potential issues and minimizes downtime impact.
4. User Interface and Reporting:
- UptimeRobot provides a user-friendly web interface to access all monitoring data, reports, and settings.
- You can:
- View real-time uptime and performance overviews.
- Analyze historical trends and identify patterns.
- Customize dashboards and monitoring configurations.
- Generate detailed reports for deeper analysis and sharing.
Additional Architectural Aspects:
- Scalability: The distributed architecture can handle large volumes of monitoring data from diverse users efficiently.
- Security: Data transmission and storage are protected with industry-standard encryption protocols.
- High Availability: Redundancy measures ensure minimal downtime and uninterrupted monitoring even during unexpected events.
- API Access: Access and manage your monitoring data programmatically through UptimeRobot’s API.
Overall, UptimeRobot’s architecture emphasizes efficient data collection, reliable analysis, and timely notifications, empowering users to proactively monitor their websites and services and maintain optimal performance.
How to Install UptimeRobot it?
UptimeRobot doesn’t require any traditional installation since it’s a web-based service. You don’t need to download or install any software on your server or computer. Here’s how you get started:
1. Sign Up:
- Head over to UptimeRobot’s website.
- Click on the “Sign Up” button.
- Generate an account by providing your email address and setting a password.
2. Choose Your Plan:
- UptimeRobot offers a free plan and various paid Pro plans with additional features and monitoring capacity.
- Explore the available plans and choose the one that best suits your needs. You can always upgrade or downgrade later as your monitoring requirements evolve.
3. Add Monitors:
- Once you’ve chosen a plan, click on “Add New Monitor” in your UptimeRobot dashboard.
- Select the monitor type (website, server, API, etc.) based on what you want to monitor.
- Enter the URL, IP address, or API endpoint of your target.
- Configure the monitoring settings, such as check frequency, alert thresholds, and notification channels.
- Save the monitor.
4. Start Monitoring:
- UptimeRobot will automatically start monitoring your chosen elements based on your settings.
- You can access real-time and historical data, reports, and insights within your UptimeRobot dashboard.
Always keep in mind, you can try UptimeRobot’s free plan with its essential features before committing to a paid plan. This allows you to explore the platform and test its functionalities to see how it can benefit your website and service monitoring needs.
Basic Tutorials of UptimeRobot: Getting Started
UptimeRobot is a user-friendly platform, but here’s a step-by-step guide to get you started with the basic functionalities on the free plan:
1. Creating an Account:
- Go to UptimeRobot and click “Sign Up.”
- Enter your email address and choose a strong password.
- Verify your email and log in to your UptimeRobot dashboard.
2. Adding Your First Website Monitor:
- Click “Add New Monitor” in the left-hand menu.
- Select “Website” as the monitor type.
- Put the URL of your site in the “URL” field.
- Select a friendly “Monitor Name” for simple identification.
- Set the “Check Frequency” (e.g., every minute, 5 minutes, etc.).
- Leave the “Alert Threshold” at the default (down for 1 minute) for now.
- Choose your preferred notification channels (e.g., email, SMS).
- Click “Save Monitor.”
3. Checking Uptime and Performance:
- Your website will be automatically monitored based on your settings.
- You can see its real-time status in the “Monitors” list (green for up, red for down).
- Click the monitor name for detailed information like uptime percentage, response times, and historical data.
4. Setting Up Custom Alerts:
- Go to the monitor’s settings by clicking its name.
- Click the “Alert Settings” tab.
- You can adjust the “Alert Threshold” (e.g., down for 2 minutes).
- Configure additional alert conditions like keyword presence/absence.
- Set up different notification escalation levels for prolonged downtime.
- Click “Save Changes” to apply your adjustments.
5. Exploring Additional Features:
- UptimeRobot offers free monitoring for up to 50 websites and basic features like ping monitoring, port monitoring, and keyword monitoring.
- You can explore these features by adding new monitors of the respective types.
- Remember, the free plan has limitations, so consider upgrading to a Pro plan for increased monitoring capacity and advanced features like RUM, synthetic monitoring, and status pages.
Tips:
- Utilize the “Monitor Groups” feature to organize your website monitors for better management.
- Take advantage of integrations with tools like Slack and PagerDuty for seamless notifications.
By following these steps and exploring further features, you can master the basics of UptimeRobot and ensure your websites stay up and running smoothly.

Find Trusted Cardiac Hospitals
Compare heart hospitals by city and services — all in one place.
Explore Hospitals