What is YourKit Java Profiler ?
YourKit Java Profiler is a powerful performance analysis tool for Java applications developed by YourKit LLC. It helps developers and performance engineers diagnose and optimize the performance of Java applications.
Top 10 use cases of YourKit Java Profiler ?
Here are the top 10 use cases for YourKit Java Profiler:
- CPU Profiling:
- Identify CPU-intensive methods and hot spots in Java applications.
- Analyze method execution times and thread activity to pinpoint performance bottlenecks.
- Memory Profiling:
- Analyze memory usage, object allocations, and garbage collection behavior.
- Detect memory leaks and excessive memory consumption to optimize memory usage.
- Thread Profiling:
- Monitor thread activity, synchronization, and contention within Java applications.
- Identify threading issues and optimize concurrency for better performance.
- Database Profiling:
- Profile database interactions, including JDBC calls and SQL query execution times.
- Identify slow database queries and optimize database access for improved performance.
- Java EE Profiling:
- Profile Java EE components such as servlets, EJBs, and JMS messaging.
- Analyze performance metrics for Java EE applications and identify areas for optimization.
- Integration Testing:
- Use YourKit Java Profiler for performance testing and analysis during integration testing.
- Identify performance regressions and ensure that applications meet performance requirements.
- Continuous Integration (CI):
- Integrate YourKit Java Profiler into CI/CD pipelines for automated performance testing.
- Detect performance issues early in the development process and prevent regressions.
- Memory Leak Detection:
- Detect memory leaks by analyzing heap dumps and identifying objects that are not being garbage collected properly.
- Optimize memory allocation and prevent memory-related issues in Java applications.
- Performance Tuning:
- Use YourKit Java Profiler’s recommendations and suggestions to optimize JVM settings, garbage collection parameters, and thread configurations.
- Fine-tune Java applications for optimal performance and resource utilization.
- Production Monitoring:
- Use YourKit Java Profiler for lightweight profiling and monitoring of Java applications in production environments.
- Capture performance snapshots and analyze them offline to diagnose production issues and optimize application performance.
YourKit Java Profiler offers a comprehensive set of features for Java performance analysis and optimization, making it a valuable tool for developers and performance engineers working with Java applications.
What are the feature of YourKit Java Profiler ?
YourKit Java Profiler is a feature-rich tool designed to help developers diagnose and optimize the performance of Java applications. Following are some of its key features:
- CPU Profiling:
- Identify CPU hot spots and performance bottlenecks by analyzing method execution times, thread activity, and CPU usage.
- View call trees and method invocation chains to understand the flow of execution in your application.
- Memory Profiling:
- Analyze memory usage, object allocations, and garbage collection behavior to identify memory leaks and optimize memory usage.
- View memory retention paths to understand why objects are being held in memory and optimize object lifecycles.
- Thread Profiling:
- Monitor thread activity, synchronization, and contention to optimize concurrency and identify threading issues.
- View thread dumps and analyze thread states to identify blocked or waiting threads.
- Database Profiling:
- Profile database interactions, including JDBC calls, SQL query execution times, and database connection usage.
- Identify slow database queries and optimize database access for improved performance.
- Java EE Profiling:
- Profile Java EE components such as servlets, EJBs, JMS messaging, and web services.
- Analyze performance metrics for Java EE applications and identify areas for optimization.
- Memory Leak Detection:
- Detect memory leaks by analyzing heap dumps and identifying objects that are not being garbage collected properly.
- Analyze object references and retention paths to pinpoint memory leak sources.
- Integration with IDEs:
- Integrate YourKit Java Profiler with popular Java IDEs such as IntelliJ IDEA, Eclipse, and NetBeans for seamless profiling directly within the development environment.
- Live Profiling:
- Profile Java applications in real-time without requiring application restarts or code modifications.
- Monitor application performance and analyze profiling data dynamically during runtime.
- Remote Profiling:
- Profile Java applications running on remote servers or virtual machines.
- Analyze performance data from distributed systems and aggregate it for analysis.
- Continuous Integration (CI):
- Integrate YourKit Java Profiler into CI/CD pipelines for automated performance testing.
- Detect performance regressions early in the development process and ensure application performance meets requirements.
- Custom Probes:
- Create custom probes to profile specific parts of your Java applications and gather additional performance data.
- Customize profiling settings and instrumentation to suit your application’s specific requirements.
- Advanced Analysis Tools:
- Use advanced analysis tools such as allocation hot spots, thread contention analysis, and object allocation recording to gain deeper insights into application performance.
These features make YourKit Java Profiler a comprehensive tool for diagnosing and optimizing the performance of Java applications, helping developers improve application responsiveness, scalability, and resource efficiency.
How YourKit Java Profiler works and Architecture?
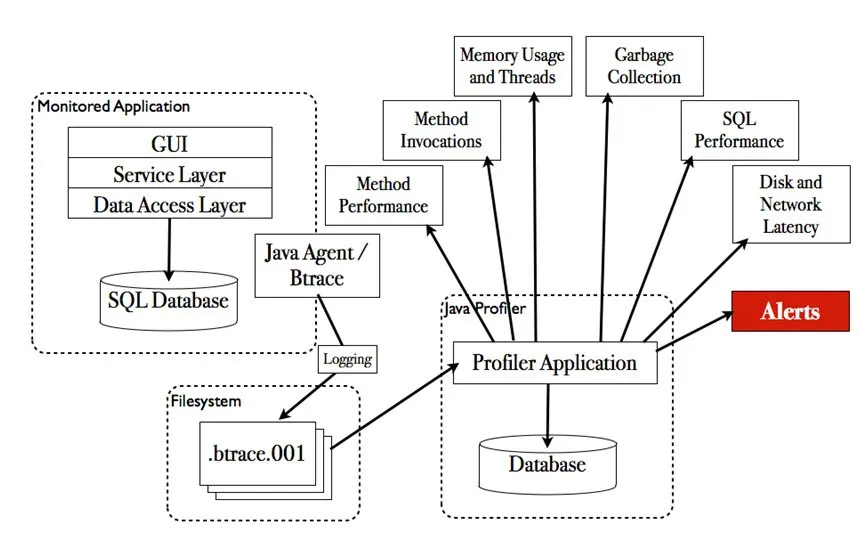
YourKit Java Profiler operates by attaching to Java applications during runtime and gathering performance data for analysis. Here’s an overview of how it works and its architecture:
- Agent-Based Profiling:
- YourKit Java Profiler utilizes an agent-based approach. A profiler agent is attached to the Java Virtual Machine (JVM) running the target Java application.
- The profiler agent injects bytecode instrumentation into the JVM, enabling it to collect performance data without requiring modifications to the application’s source code.
- Integration with JVM:
- Upon startup, the profiler agent attaches to the JVM process hosting the Java application being profiled.
- It establishes communication with the YourKit Java Profiler client, enabling data transmission and receiving configuration commands.
- Profiling Triggers:
- YourKit Java Profiler allows users to set profiling triggers based on specific conditions or events.
- These triggers can be configured to capture performance metrics such as CPU usage thresholds, memory allocations, method invocations, or thread activity.
- Profiling Modes:
- YourKit Java Profiler supports multiple profiling modes tailored to different performance analysis objectives.
- Common modes include CPU profiling, memory profiling, thread profiling, and database profiling.
- Users can select the appropriate profiling mode based on the aspect of application performance they wish to analyze.
- Data Collection:
- The profiler agent collects runtime performance data directly from the JVM. This data includes method execution times, memory allocations, thread states, database interactions, and more.
- Collected data is aggregated and transmitted to the YourKit Java Profiler client for visualization and analysis.
- Visualization and Analysis:
- The YourKit Java Profiler client provides a user-friendly interface for visualizing and analyzing the collected performance data.
- Users can explore various profiling views and tools to analyze CPU usage, memory consumption, thread activity, database queries, and other aspects of application performance.
- Live Profiling:
- YourKit Java Profiler supports live profiling, enabling real-time monitoring and analysis of Java applications during runtime.
- Developers can observe performance metrics dynamically without the need for application restarts or code modifications.
- Remote Profiling:
- YourKit Java Profiler offers remote profiling capabilities, allowing users to profile Java applications running on remote servers or virtual machines.
- This enables analysis of performance data from distributed systems and facilitates centralized performance monitoring.
- Integration with IDEs:
- YourKit Java Profiler seamlessly integrates with popular Java Integrated Development Environments (IDEs) such as IntelliJ IDEA, Eclipse, and NetBeans.
- Integration simplifies the profiling process, enabling developers to profile and analyze Java applications directly within their preferred development environment.
YourKit Java Profiler’s architecture enables comprehensive profiling and analysis of Java applications, providing developers with valuable insights into application performance and facilitating optimization efforts.
How to Install YourKit Java Profiler it?
Certainly! Let’s explore how to install YourKit Java Profiler, a powerful profiler for Java applications:
- Interactive Installation:
- Download the profiler archive from the YourKit website.
- Choose the appropriate version for your operating system (Linux, macOS, or Windows).
- Follow the installation steps based on your OS:
- Linux:
- Download and unzip the profiler archive.
- Run the profiler using the command:
YourKit-JavaProfiler-2023.9/bin/profiler.sh -accept-eula -license-key=<key> - Replace
<arch>,<build>, and<key>with actual values.
- macOS:
- Download and mount the disk image.
- Pull the profiler app to the Applications folder.
- Run the profiler using the command:
~/Applications/YourKit-Java-Profiler-2023.9.app/Contents/Resources/bin/profiler.sh -accept-eula -license-key=<key>
- Windows:
- Download and run the installer following the wizard steps.
- Run the profiler using the command:
C:\profiler\bin\profiler.exe -accept-eula -license-key=<key>
- Linux:
2. Unattended Installation:
- For automation purposes, perform an unattended installation without user interaction.
- Use command line options to enter the license key and accept the profiler EULA.
Remember to replace placeholders like <arch>, <build>, and <key> with actual values during installation! 🚀🗄️
Basic Tutorials of YourKit Java Profiler : Getting Started
Now, Let’s explore some step-by-step tutorials for using YourKit Java Profiler, a powerful profiler for Java applications:
- Introduction to YourKit Java Profiler:
- YourKit Java Profiler is a versatile tool for analyzing and optimizing Java applications.
- It provides insights into memory usage, CPU performance, thread behavior, and more.
- Here are some key steps to get started:
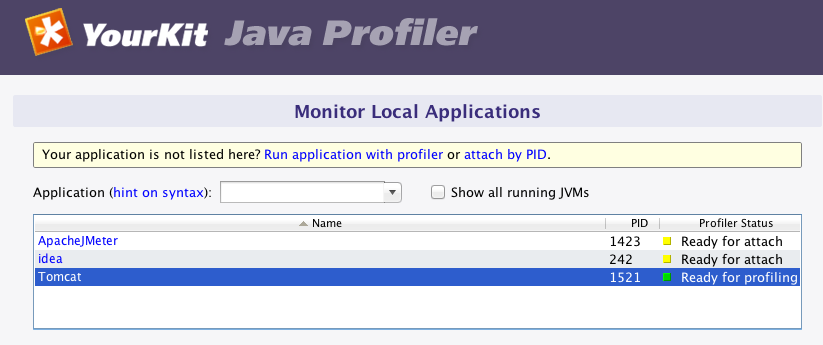
2. Start Profiling:
- Launch YourKit Java Profiler.
- Connect it to your Java application by specifying the application’s PID (Process ID) or attaching it to a running JVM.
- The profiler will start collecting data immediately.
3. Memory Profiling:
- Explore memory usage:
- View object allocations, memory leaks, and garbage collection behavior.
- Analyze memory snapshots and identify memory-hungry objects.
- Optimize memory usage by analyzing retained objects.
4. CPU Profiling:
- Investigate CPU bottlenecks:
- Capture CPU snapshots during application execution.
- Analyze hotspots, method call trees, and thread activity.
- Optimize code paths causing high CPU usage.
5. Thread Profiling:
- Understand thread behavior:
- Monitor thread states, locks, and contention.
- Identify thread-related performance issues.
- Optimize thread synchronization.
6. Database Profiling:
- Profile database interactions:
- Integrate with JDBC drivers to analyze SQL queries.
- Identify slow database calls and optimize them.
- Monitor database connection pools.
7. Advanced Features:
- Explore additional features like exception profiling, custom probes, and remote profiling.
- Use triggers to automatically start profiling when specific conditions are met.
YourKit Java Profiler empowers you to optimize your Java applications for better performance! 🚀🗄️

Find Trusted Cardiac Hospitals
Compare heart hospitals by city and services — all in one place.
Explore Hospitals