What is Zabbix?
Zabbix is a powerful and open-source monitoring solution designed to give you comprehensive visibility into your IT infrastructure. It goes beyond basic monitoring by providing real-time data collection, analysis, and visualization for a wide range of IT components, including:
- Servers and networks: Track performance metrics like CPU load, memory usage, and network traffic.
- Applications and services: Monitor application health, uptime, and response times.
- Databases and storage: Ensure database performance and storage capacity.
- Virtualization platforms: Keep an eye on your virtual machines and host health.
- Cloud resources: Gain insights into the performance and utilization of your cloud resources.
Top 10 use cases of Zabbix?
Top 10 Use Cases of Zabbix:
- Performance Monitoring: Identify and resolve performance bottlenecks across your entire IT infrastructure.
- Availability and uptime monitoring: Ensure high availability of critical applications and services.
- Capacity planning: Proactively identify potential resource capacity issues and plan for future growth.
- Application troubleshooting: Quickly pinpoint the root cause of application performance problems.
- Security monitoring: Detect and investigate potential security threats.
- Compliance reporting: Create reports to eloborate compliance with industry regulations and standards.
- Cost optimization: Monitor resource utilization and identify opportunities for cost savings.
- Root cause analysis: Drill down to the exact source of issues through detailed diagnostics and tracing.
- Automated alerting and notifications: Receive timely alerts about critical issues or performance anomalies.
- Customizable dashboards and reports: Visualize key metrics and insights in a way that’s meaningful to you.
Zabbix is a flexible and scalable solution that can be customized to meet the specific needs of your organization. It’s ideal for both small and large businesses, with features that cater to both simple and complex IT environments.
Here are some additional benefits of using Zabbix:
- Open-source and free: No licensing fees involved, making it cost-effective for everyone.
- Wide range of platforms supported: Monitors various Linux, Unix, Windows, and Mac systems.
- Highly customizable: Create custom dashboards, triggers, and scripts to tailor the solution to your needs.
- Active community and support: Access a large community of users and developers for help and advice.
If you’re looking for a powerful and flexible monitoring solution, Zabbix is definitely worth considering!
What are the feature of Zabbix?
Zabbix boasts a feature-rich package designed to provide comprehensive monitoring and observability across your entire IT infrastructure. Here are some key highlights:
Data Collection and Ingestion:
- Flexible Data Sources: Supports a wide range of data sources, including network devices, servers, applications, databases, cloud platforms, and custom scripts.
- Agent-based and Agentless Monitoring: Utilize agents for in-depth system monitoring or leverage agentless methods for lightweight data collection.
- Push and Pull Data Transfer: Choose how data is transmitted to Zabbix based on your network configuration and preference.
Data Analysis and Visualization:
- Real-time Data Visualization: Monitor key metrics in real-time through customizable dashboards and reports.
- Trend Analysis and Forecasting: Analyze historical data trends and predict potential issues before they occur.
- Alerting and Notifications: Set up customized alerts for critical events and performance anomalies to receive timely notifications.
- Root Cause Analysis: Drill down to the source of issues with detailed historical data and diagnostic tools.
Configuration and Management:
- Flexible User Roles and Permissions: Define user roles and permissions to control access and manage configurations.
- API Access and Automation: Automate tasks and integrate Zabbix with other tools through its powerful API.
- High Availability and Scalability: Zabbix can be configured for high availability and easily scales to meet the needs of large and complex environments.
- Open-source Community and Support: Benefit from a vibrant community of users and developers for support and learning resources.
Additional Features:
- Discovery and Automatic Configuration: Automatically discover new devices and configure monitoring items.
- Geolocation and Maps: Visualize your IT infrastructure on geographical maps for better context.
- Mobile App: Access monitoring data and receive alerts on the go through the Zabbix mobile app.
- Security Monitoring: Integrate security tools and plugins to monitor for potential threats.
These features make Zabbix a powerful tool for:
- Improving the performance and availability of your IT infrastructure.
- Identifying and resolving issues quickly and efficiently.
- Proactively predicting and preventing future problems.
- Optimizing resource utilization and costs.
- Gaining deeper insights into your IT environment.
How Zabbix works and Architecture?
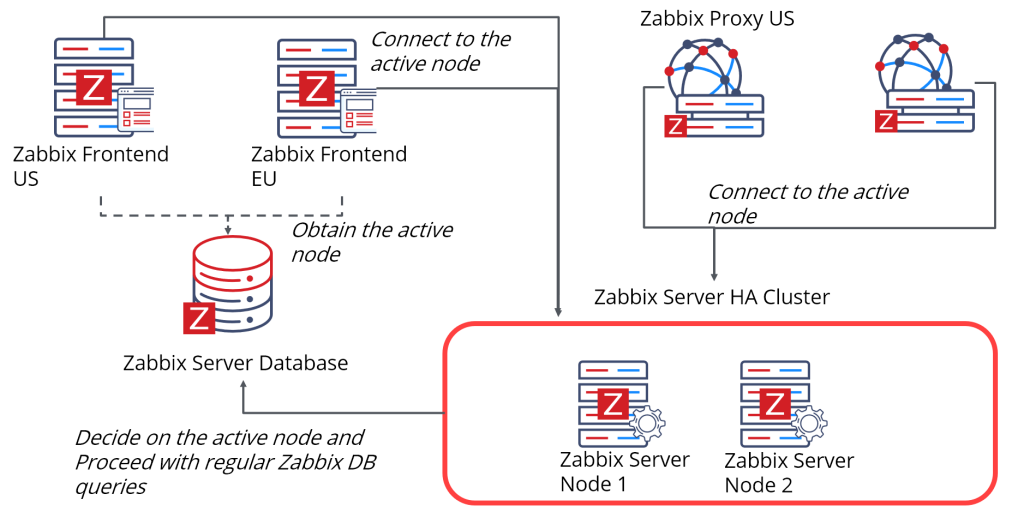
Zabbix’s power lies in its modular architecture, designed for efficient data collection, processing, and visualization across diverse IT environments. Here’s a breakdown of the key components:
Data Ingestion:
- Data Sources: These represent points of data collection, including servers, applications, and network devices. They can be configured to feed data through agents or agentless methods.
- Agents: Installed on target systems, agents actively collect data and send it to the Zabbix server at defined intervals.
- Agentless Monitoring: For lightweight data collection, Zabbix supports agentless methods like SNMP, WMI, and JMX to pull data directly from devices.
- Pre-processing and Validation: Incoming data is validated, converted to a common format, and stored in the database.
Data Analysis and Visualization:
- Database: Zabbix stores collected data in a relational database, allowing for efficient storage, retrieval, and analysis.
- Web Front-end: This user interface provides access to dashboards, reports, alerts, and configuration settings.
- Triggers and Actions: Users define triggers based on specific criteria for key metrics. When these triggers fire, Zabbix performs pre-configured actions like sending alerts or executing scripts.
- Visualization and Reporting: Customizable dashboards and reports present data in real-time and historical views, offering rich insights and actionable intelligence.
Key Architectural Highlights:
- Modular Design: Enables flexibility and scalability, allowing Zabbix to adapt to diverse environments.
- Agent-based and Agentless Options: Provides choices for in-depth monitoring or lightweight data collection.
- Centralized Server: Offers a single point of control for data analysis, visualization, and alerting.
- Triggers and Actions: Proactive notifications and automated responses help address issues quickly.
Additional Layers:
- API Access: Integrate Zabbix with other tools and platforms for automated workflows and data exchange.
- User Roles and Permissions: Manage access and control configurations for different users.
- High Availability and Scalability: Zabbix can be configured for redundancy and easily scales to handle large infrastructure complexities.
Benefits of this architecture:
- Efficient Data Collection: Flexible options cater to diverse data sources and collection methods.
- Centralized Management: Simplifies administration and monitoring tasks from a single platform.
- Real-time Insights and Proactive Actions: Continuous data analysis and automated responses ensure timely problem identification and resolution.
- Scalability and Adaptability: Zabbix can handle small and large deployments with ease.
How to Install Zabbix it?
Installing Zabbix can be tailored to your specific needs and preferences. Here’s a general outline of the different options:
1. Package Manager Installation:
- Pre-built packages: Most Linux distributions offer Zabbix packages through their package managers (apt, yum, etc.). This is the simplest and most recommended method for beginners.
- Download RPM/DEB packages: For manual installation, download the appropriate RPM or DEB package from the Zabbix website and use your package manager to install it.
2. Manual Installation:
- Download source code: For advanced users, download the Zabbix source code and compile it manually. This offers more control over the installation but requires technical expertise.
- Pre-built binaries: Download pre-built binaries for specific platforms from the Zabbix website and follow the manual installation guide.
3. Appliance and Docker Images:
- Zabbix Appliance: This ready-to-use virtual appliance simplifies deployment for pre-configured environments.
- Docker Images: Official Docker images are available for Zabbix server and frontend, ideal for containerized deployments.
4. Cloud Deployments:
- Major cloud providers: Zabbix provides deployment guides for AWS, Azure, and GCP, simplifying cloud-based installations.
Important Steps for all Installation Methods:
- System Requirements: Ensure your system meets the minimum requirements for the Zabbix version you choose.
- Database Configuration: Set up a compatible database server (MySQL, MariaDB, PostgreSQL) for Zabbix data storage.
- Web Server Configuration: Configure a web server (Apache, Nginx) to host the Zabbix web interface.
- Configuration Files: Edit configuration files to specify database connection details, server settings, and desired features.
- Start Services: Start the Zabbix server and web server processes.
- Initial Setup: Access the Zabbix web interface and complete the initial configuration wizard.
Note: Choose the installation method that suits your technical skillset and environment. The manual installation offers more control but requires more technical expertise. If you’re unsure, opting for the pre-built packages or the Zabbix appliance can be easier.
Basic Tutorials of Zabbix: Getting Started
Ready to dive into the world of Zabbix and gain control over your IT infrastructure? Let’s embark on a step-by-step journey to unlock its basic capabilities:
1. Installation:
- Choose your preferred method:
- Package Manager: Easiest for most Linux users. Use your system’s package manager to install the Zabbix server and agent packages.
- Binary Download: Download the pre-built binary for your OS from the Zabbix website and follow the installation instructions.
- Docker: Utilize Docker to deploy Zabbix as a container. This offers a lightweight and portable approach.
2. Initial Configuration:
- Zabbix Server: Configure the
zabbix_server.conffile with database settings, user credentials, and other essential parameters. - Zabbix Web Interface: Access the web interface at
http://localhost/zabbix(default). Login with the default credentials (Admin/Admin). - Database Setup: Import the provided SQL schema into your chosen database (e.g., MySQL, PostgreSQL).
3. Adding Hosts and Items:
- Hosts: Define the servers, devices, and applications you want to monitor. Add hosts by providing their IP addresses or DNS names.
- Items: Configure specific metrics to be collected from each host. Examples include CPU usage, disk space, network traffic, etc. Choose appropriate item types based on the data you want to collect.
4. Creating Triggers and Alerts:
- Triggers: Define conditions based on item values. When a trigger condition is met (e.g., CPU usage exceeding a threshold), it will trigger an alert.
- Alerts: Set up how you want to receive alerts: email, SMS, web notifications, etc. Configure escalation options to ensure critical issues are addressed promptly.
5. Exploring Monitoring Data:
- Dashboards: Create dashboards to visualize key metrics from multiple hosts and items in one place. Use charts, graphs, and tables to present the data intuitively.
- Reports: Generate reports for historical data analysis and identify trends or patterns in your monitored systems’ performance.
- Maps: Create network maps to visualize the relationships between your monitored systems and gain a holistic view of your IT infrastructure.
6. Expanding Your Monitoring:
- User Management: Create user accounts with different access levels to control monitoring privileges.
- Extensions: Explore the vast Zabbix extension ecosystem to add new functionalities, like custom item types, notification channels, and integrations with other tools.
- API: Zabbix offers a powerful API for programmatic automation and integration with your existing IT management workflows.
Note:
- Start small by monitoring a few essential metrics from a limited number of hosts.
- Gradually expand your monitoring scope as you gain confidence and understanding.
- Refer to the Zabbix documentation and community resources for detailed configuration options and troubleshooting assistance.
- Don’t hesitate to experiment and explore Zabbix’s capabilities to tailor your monitoring solution to your specific needs.
Tip: Try the Zabbix Demo:
- The Zabbix website provides a fully functional demo environment where you can try out all the features without installing anything.
- This is a great way to familiarize yourself with the interface and basic functionalities before setting up your own Zabbix server.
By following these steps and embracing the flexibility of Zabbix, you’ll be well on your way to building a comprehensive and effective monitoring system for your IT infrastructure. Remember, Zabbix is a powerful tool, so keep learning, keep exploring, and unlock its full potential to gain valuable insights and ensure the smooth operation of your IT environment.

Find Trusted Cardiac Hospitals
Compare heart hospitals by city and services — all in one place.
Explore Hospitals
Thanks for the clear and practical explanation of Zabbix! I appreciated how the article covered both what Zabbix is and the real‑world use cases — like monitoring network devices, servers, applications, and alerting when performance issues arise. The examples make it easy to understand how Zabbix helps teams stay on top of infrastructure health and troubleshoot problems before they impact users. Great job making a technical topic feel accessible and useful!