What is Zipkin?
Zipkin is a distributed tracing system originally developed by Twitter to shed light on the complex interactions within distributed applications. It provides a powerful way to track requests as they flow through microservices, pinpointing slowdowns and performance issues. Think of it as a magnifying glass for your application’s internal dance moves!
Here are some key features of Zipkin:
- Distributed Tracing: Identifles the entire path of a request across multiple services, even when they run on different machines or platforms.
- Latency Analysis: Pinpoints performance issues by displaying how much time each service takes to process a request.
- Error Detection: Catches errors and exceptions that might go unnoticed in traditional monitoring solutions.
- Visualized Data: Presents trace data in user-friendly interfaces with charts and graphs for easy understanding.
- Open Source: Freely available and customizable to integrate with your existing monitoring workflow.
Top 10 use cases of Zipkin?
Top 10 Use Cases of Zipkin:
- Troubleshooting complex service interactions: Uncover root causes of performance issues or service failures that occur within distributed applications.
- Optimizing microservice architecture: Identify communication patterns and potential inefficiences between microservices to optimize their interactions.
- Improving user experience: Analyze how user requests flow through your system and identify potential points of friction that affect user experience.
- Monitoring server performance: Track individual server response times and CPU utilization to pinpoint overloaded systems or resource allocation issues.
- Identifying error hotspots: Locate services encountering frequent errors or slowdowns and prioritize their investigation and resolution.
- Correlating logs and metrics: Use trace data to link together log entries and metrics, providing broader context for performance issues and errors.
- Understanding API usage: Analyze call patterns to your internal or externalAPIs and identify inefficiences or underutilized routes.
- Improving developer workflows: Provide developers with actionable insights into their code’s performance and potential areas for optimization.
- Security investigations: Use trace data to track suspicious activity and investigate potential security breaches or vulnerabilities.
- Building a comprehensive observability ecosystem: Integrate Zipkin with other monitoring tools and platforms for a unified view of your application performance and health.
By utilizing these diverse use cases, Zipkin empowers you to gain deeper insights into your distributed applications, improve their performance, and ensure a smooth and efficient user experience. Remember, Zipkin is just one tool in your observability toolbox, but it can be a powerful one for demystifying the often-opaque realm of distributed systems.
What are the feature of Zipkin?
Zipkin’s features unlock a world of intricate insights into your distributed applications, empowering you to optimize performance and provide seamless user experiences. Let’s delve into some key features:
Distributed Tracing:
- Traces the entire journey of a request: Track how a request hops across multiple microservices, revealing interactions and potential bottlenecks.
- Span-based analysis: Each service call within the request becomes a “span,” providing granular details about its timing, context, and dependencies.
- Visualized timelines: Render traced timelines with interactive charts and graphs, making complex request flows easy to understand.
Latency Analysis:
- Pinpoint slow and inefficient services: Identify services taking the longest to process requests, contributing to overall application latency.
- Analyze per-span timings: See how much time each service takes within a trace, pinpointing specific actions impacting performance.
- Bottleneck detection: Visualize hot spots where requests pile up, indicating areas for optimization.
Error Detection and Debugging:
- Capture application and service errors: Surface errors encountered during request processing within traces, offering context for troubleshooting.
- Correlate errors with trace data: Link error logs to specific spans in the trace, providing deeper insights into their source and impact.
- Simplify root cause analysis: Use error data to quickly identify the service or code responsible for causing issues.
Data Visualizations:
- Interactive dashboards: Create custom dashboards to visualize key metrics like trace volume, error rates, and service latencies.
- Anomaly detection: Identify unusual patterns or spikes in trace data, indicating potential problems requiring attention.
- Flexible filtering and drill-down: Filter traces by service, time frame, or specific tags for targeted analysis and deeper investigation.
Open Source and Extensible:
- Freely available and customizable: Integrate Zipkin into your existing monitoring ecosystem and tailor it to your specific needs.
- Wide range of integrations: Connects with popular monitoring tools, logging platforms, and cloud providers for broader observability.
- Support for custom instrumentation: Extend Zipkin’s capabilities by writing custom collectors and exporters for specialized data sources.
Additional Features:
- Sampling strategies: Manage data volume by selectively sampling traces for analysis, especially in large environments.
- Distributed storage and querying: Scale your tracing operation with distributed storage solutions and efficient query capabilities.
- Security and access control: Configure access permissions and ensure secure handling of collected trace data.
By leveraging these features, Zipkin helps you gain a comprehensive understanding of your distributed applications, optimize performance, improve user experience, and ensure the smooth operation of your entire microservices landscape. Remember, Zipkin is just one powerful tool in your observability toolbox. Embrace its capabilities and unveil the mysteries of your distributed systems!
How Zipkin works and Architecture?
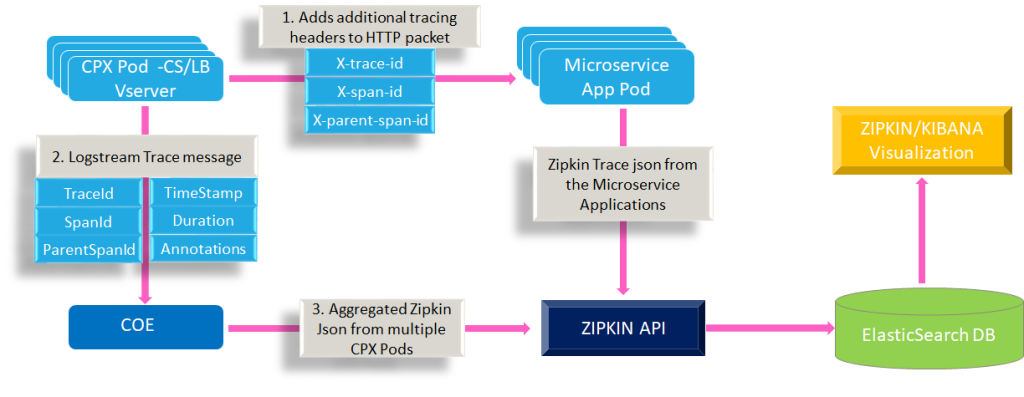
Zipkin’s internal workings and architecture involve a collaborative dance of components, providing you with insights into your distributed applications. Let’s break it down step-by-step:
1. Instrumentation:
- Applications are instrumented with libraries or frameworks (e.g., Python-zipkin, Java-zipkin) that generate trace data.
- Each service call becomes a “span” with details like timestamps, service name, operation name, and context (tags).
2. Data Collection:
- Traced data is sent to Zipkin collectors via HTTP or other supported protocols.
- Collectors can be local (on the same machine) or remote (centralized server).
- Sampling strategies can be applied to manage data volume in large environments.
3. Data Processing:
- Collectors validate and store trace data, often using databases like Cassandra or Elasticsearch.
- Traces are indexed for efficient querying and retrieval based on service, time, or other criteria.
4. Data Visualization and Analysis:
- The Zipkin UI provides interactive dashboards and charts to visualize trace data.
- Traces are displayed as timelines, highlighting spans and their timings.
- You can filter, drill down, and analyze specific traces to identify performance bottlenecks or error sources.
Zipkin Architecture Components:
- Tracers: Libraries or frameworks embedded in applications to generate trace data.
- Collectors: Receive traced data from instrumented applications and store it.
- Storage: Databases like Cassandra or Elasticsearch store and index trace data for efficient retrieval.
- Query Service: Manages trace queries and returns them to the UI.
- Web UI: Visualizes trace data through interactive dashboards and charts.
Key Takeaways:
- Zipkin uses a distributed architecture with independent components for scalability and efficiency.
- Traced data is collected, processed, stored, and visualized to provide insights into application behavior.
- The architecture is flexible and extensible, allowing integration with various tools and platforms.
Note:
- Zipkin’s complexity is hidden behind its user-friendly UI, making it easily accessible even for non-technical users.
- Open-source nature allows for customization and integration with your specific monitoring ecosystem.
- Start small by instrumenting a few services and gradually expand your tracing scope as your understanding grows.
How to Install Zipkin it?
Installing Zipkin can be done in several ways, depending on your preference and environment. Here are some options:
1. Docker:
- The quickest and easiest option! Pull the official Docker image (
openzipkin/zipkin) and run it on your container platform. - This image contains all pre-configured components (collector, storage, UI) for a basic setup.
- Ideal for local development or quick experimentation.
2. Manual Installation:
- Download the pre-built binaries for your platform (Linux, macOS, Windows) from the Zipkin website.
- Set up the collector, storage (e.g., Cassandra), and UI in separate processes.
- This option offers more control and customization for production environments.
3. Package Managers:
- Use your system’s package manager if available (e.g.,
apt,yum) for your platform. - This simplifies installation and updates on Linux systems.
4. Cloud Providers:
- Some cloud providers offer managed Zipkin services that are pre-configured and ready to use.
- This option is convenient for cloud-based deployments but might have limited customization options.
5. Alternative Deployments:
- Use Kubernetes manifests to deploy Zipkin as a Kubernetes application.
- Utilize platforms like OpenShift or Cloud Foundry for managed deployments.
Choosing the Right Method:
- Local Development: Docker or manual installation with a lightweight database work well.
- Production Environments: Package managers or cloud services offer easier operation and scaling.
- Specific needs: Consider alternative options like Kubernetes or OpenShift for advanced setups.
Tips:
- Start with a basic setup and gradually add additional components or integrations as needed.
- Adjust configuration files to specify data storage options, UI access, and other settings.
Basic Tutorials of Zipkin: Getting Started

Zipkin can be a powerful tool for tracing distributed systems, but getting started can seem complex. Let’s break it down into simple tutorials for different levels:
1. Introduction to Zipkin with “Hello World” (Simple)
a) Setup:
- Choose your language: Zipkin supports various languages like Java, Python, Node.js, etc.
- Install the Zipkin client library: Choose the Zipkin official site for your chosen language.
- Run a local Zipkin server: You can use Docker for a quick setup:
docker run -p 9411:9411 jaegertracing/zipkin.
b) Trace your code:
- Instrument your “Hello World” code: Add tracing calls at key points (e.g., beginning and end).
- Inject the trace context: Generate a trace ID and propagate it with outgoing requests.
- Run your application: Observe the trace in the Zipkin UI (http://localhost:9411).
2. Advanced Tracing with Microservices (Moderate)
a) Setup:
- Deploy your microservices: Ensure your microservices are running and accessible.
- Instrument each microservice: Add tracing calls to key operations within each service.
- Configure Zipkin collectors: Install and configure collectors to receive traces from your services.
- Configure Zipkin servers: Set up server instances to aggregate and visualize traces.
b) Trace a distributed call:
- Trigger a request in your first microservice.
- Observe the trace in the Zipkin UI: Follow the call flow through each microservice involved.
- Analyze bottlenecks and errors: Identify slow operations and pinpoint potential issues.
3. OpenTelemetry Integration for Advanced Instrumentation (Advanced)
a) Setup:
- Install OpenTelemetry libraries: Integrate OpenTelemetry SDK and tracing libraries in your services.
- Configure OpenTelemetry exporters: Set up exporters to send traces to Zipkin using the Zipkin exporter.
- Instrument your code with OpenTelemetry APIs: Use OpenTelemetry APIs to create spans and add attributes.
b) Leverage OpenTelemetry features:
- Automatic instrumentation: Utilize OpenTelemetry libraries for automatic instrumentation where applicable.
- Context propagation: Propagate trace context across services using OpenTelemetry’s context management.
- Unified tracing data: Combine tracing data with other OpenTelemetry metrics and logs for comprehensive monitoring.
These tutorials provide a starting point. Choose the approach that suits your needs and complexity.

Find Trusted Cardiac Hospitals
Compare heart hospitals by city and services — all in one place.
Explore Hospitals
Thanks for this helpful and practical overview of Zipkin! I liked how the article explains not only what Zipkin is but also real‑world use cases — like distributed tracing to understand latency, pinpointing bottlenecks across microservices, and improving observability in complex systems. The way you connected the tool to actual debugging and performance‑analysis scenarios makes it much easier to see how teams can apply it in practice. Great job making a technical topic feel clear and actionable!