There are some basic principles and best practices for building successful monitoring and alerting systems.
What is Monitoring?
Collecting, processing, aggregating, and displaying real-time quantitative data about a system, such as query counts and types, error counts and types, processing times, and server lifetimes.

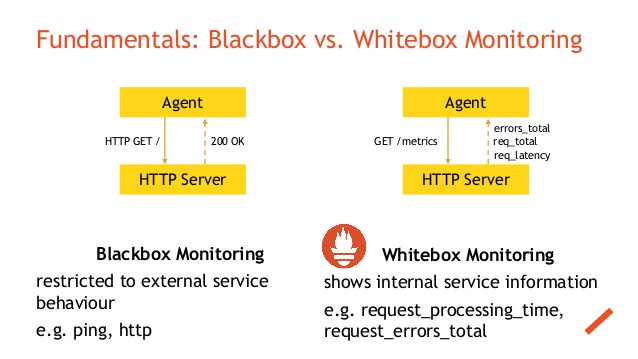
What is White Box Monitoring?
White box monitoring is the monitoring of applications running on a server. Monitoring based on metrics exposed by the internals of the system, including logs, interfaces like the Java Virtual Machine Profiling Interface, or an HTTP handler that emits internal statistics. Other types of white box monitoring include:
- Monitoring MySQL queries running on a database server.
- Looking at the number of users utilizing a web application throughout the day, and alerting if this goes above a predefined threshold.
- Considering the above example of HTTP requests—splitting these out into monitoring the different kinds to ascertain how the application is performing, or whether users are getting served the correct content. For example, a 403 would demonstrate a user has tried to get to a part of the website they’re not allowed to visit. Likewise, a 200 would indicate their request was successful and they were served the content.
- Performing advanced detection of behavior we don’t expect to see, such as a user not going through the normal steps you’d expect when signing into your application or resetting a password.
The advantages of Black Box Monitoring:
- We obtain a better overview of the situation.
- Helps optimizing the code.
- Introspection of programmers, awareness of their actions.
- Allows finding hidden errors.
- All this leads to efficiency in finding errors and problems.
Disadvantages of whitebox testing:
- We need to know the source code of the involved software(s).
- Requires a high level of understanding and experience of the affected program.
List of White Box Monitoring tools
- Prometheus
- Pandora FMS
- Zabbix
- NewRelic
- AppDynamics
What is Black Box Monitoring?
Black box monitoring refers to the monitoring of servers with a focus on areas such as disk space, CPU usage, memory usage, load averages, etc. Testing externally visible behavior as a user would see it. These are what most in the industry would deem as the standard system metrics to monitor. Other types of black box monitoring include:
- Monitoring of network switches and other networking devices such as load balancers from the system metrics perspective, as defined above.
- Looking at hypervisor-level resource usage for all virtual machines running on the hypervisor (such as VMware, KVM, Xen, etc.).
- Alerting on hard disk errors that may present a problem if a disk isn’t replaced soon (using SMART, for instance).


List of Black Box Monitoring tools
- Nagios
- Datadog
- Sysdig
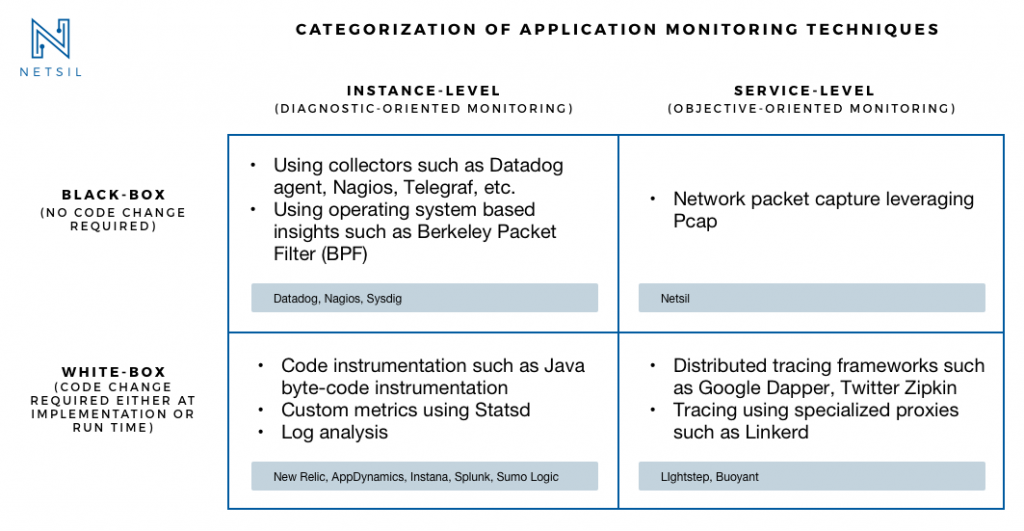
Difference between White Box Monitoring and Black Box Monitoring?
There are differences between these two types of monitoring. Traditionally, systems administrators would take care of both white and black box monitoring; however, with the advent of DevOps and modern changes in the IT industry, we’re increasingly finding that application developers are taking responsibility for the monitoring of the applications (white box) they’re writing and as a result, are building monitoring solutions or writing checks for monitoring systems deployed by DevOps engineers.
Systems administrators and DevOps engineers tend to take responsibility for the monitoring of black box items such as servers. There is some crossover where DevOps engineers can also take responsibility for white box monitoring, but this depends on the business or environment you’re working in.
I’m Rajesh Kumar, a DevOps, SRE, DevSecOps, Cloud, and Platform Engineering expert passionate about sharing practical knowledge, real-world experiences, and industry best practices. I have worked at Cotocus and regularly write about technology, travel, investing, health, product reviews, and digital marketing through my various platforms.
I publish technical articles at DevOps School, travel stories at Holiday Landmark, stock market insights at Stocks Mantra, health and fitness guidance at My Medic Plus, product reviews at TrueReviewNow, and SEO and digital marketing strategies at Wizbrand.
Find Trusted Cardiac Hospitals
Compare heart hospitals by city and services — all in one place.
Explore Hospitals