Obserbability Advanced Training
Scale an observability platform for many teams with long-term storage, sampling, cost controls and organisation-wide standards. Learn Obserbability through a clear Foundation to Advanced path, with hands-on labs, live cohort options, certification support and full LMS access.
Last updated
Self-paced video subscription
Billed yearly at ₹9,996. This includes all four levels, complete LMS access for one year, plus 20+ additional courses and 50+ tools access.
- All four Obserbability levels in one price.
- 20+ additional courses and 50+ tools included, even when subscribing to one course.
- Best fit for learners who want full-library access and flexible progress.
Live & Interactive session
Instructor-led cohort, max 8 to 10 hours, with demos, labs, Q&A, assignments and practical review.
- Live small-batch cohort from soon.
- Interactive discussion and lab troubleshooting.
- Recommended for teams that need guided implementation.
1:1 Live training
The same agenda, taught one-to-one by the trainer. Start immediately, without waiting for the next batch. Max 8 to 10 hours, one-to-one.
About Obserbability Advanced Training.
Understand where Obserbability fits in modern software delivery, what this level covers, and how the program builds practical confidence step by step.
Program overview
Obserbability is taught as a practical technical skill for modern engineering, operations and platform teams. The course explains where the tool fits, how it is used in real delivery environments, and how learners can apply it through guided practice.
This DevOpsSchool Obserbability program is built for working professionals who want usable skills instead of only conceptual exposure. The training emphasizes live examples, workflow clarity, operational controls and progressive skill depth from Foundation to Advanced.
Private Obserbability training for delivery teams, platform groups and engineering organizations.
DevOpsSchool provides corporate Obserbability training for teams that need faster adoption, workflow standardization, administrative control, integration guidance and governance-ready rollout. Private batches can be aligned to development practice, release workflow, access model, maturity level and internal tooling.
- Private online or classroom delivery for engineering teams
- Aligned to Obserbability usage maturity, admin depth and collaboration patterns
- Useful for rollout, migration, governance and workflow consistency goals
- Can be tailored for developers, administrators, DevOps teams and leadership stakeholders
Why teams use DevOpsSchool
DevOpsSchool combines live demonstration, practical workflow discussion, implementation-oriented examples, and strong post-session learning support. That makes the training more usable for real teams than generic slide-led courses.
Choose any level. The page still shows the full progression.
Foundation, Essential, Intermediate and Advanced are presented as one linked training flow. Self-paced buyers get all levels by default, even if they start from only one course page.
Instructor-led, self-paced and corporate delivery options.
Compare delivery format, duration, level access and batch style. Fees are shown only in the top decision panel and once again after the agenda.
| Duration | Mode | Level access | Batch |
|---|---|---|---|
| 8 to 10 Hrs. max | Live & Interactive | Advanced | Public batch |
| 8 to 10 Hrs. max | 1:1 Live training | Advanced | Starts immediately |
| 1 year LMS access | Self-paced video | All 4 levels | Anytime access |
| 5 Days | Corporate | Obserbability Advanced Training | Private team batch |
What learners should be able to do after Obserbability training.
The outcomes are written for practical delivery teams: developers, DevOps engineers, release engineers, administrators and technical leads.
Understand the three signals
Explain how logs, metrics and traces answer different questions and how they correlate.
Instrument and observe services
Instrument applications with OpenTelemetry and build dashboards and SLO alerts teams can act on.
Run observability at scale
Operate a scalable, cost-controlled observability platform with clear standards for every team.
Why this skill, what you will achieve, and who should attend.
Use this section to decide whether the course matches your role, current experience and expected Obserbability responsibilities before reviewing the detailed agenda.
Why Obserbability matters
- Obserbability helps teams standardize a critical part of their software delivery, infrastructure, automation or operations workflow.
- It gives learners a repeatable way to move from basic usage to confident execution in team and enterprise environments.
- For DevOps and platform teams, Obserbability becomes more valuable when connected with automation, governance, monitoring and delivery practices.
- Teams using Obserbability effectively reduce ad-hoc execution and move toward consistent engineering standards.
Objectives
- Understand Obserbability concepts, architecture, terminology and operational usage patterns.
- Learn practical configuration, workflow design, access controls, team usage and quality practices.
- Apply Obserbability in real delivery workflows using automation, integrations, traceability and governance patterns.
- Build practical confidence to use Obserbability for individual, team and organizational use cases.
Pre-requisites
- Basic computer literacy and familiarity with software development workflows.
- Helpful but not mandatory: introductory DevOps, cloud, automation or software delivery awareness.
- No deep programming background is required for the Foundation and Essential levels.
Who this course is for
- Developers, administrators and engineers who need practical Obserbability usage skills.
- DevOps engineers, release engineers, SREs and platform teams managing delivery standards.
- Engineering leads and technical managers responsible for workflow quality, access controls and governance.
- Corporate teams migrating to or standardizing on Obserbability.
Small-batch live training starts every month.
Weekday batches start on the 1st and weekend batches on the first Saturday of every month. One-to-one (1:1) training can start immediately; corporate sessions are scheduled on demand.
Weekend live batch
Starts on the first Saturday of every month. Weekend sessions with demos, labs and Q&A; max 10 learners.
Weekday live batch
Starts on the 1st of every month. Weekday sessions for working professionals and distributed teams; max 10 learners.
Ask advisorAgenda depth up to the selected level.
This page shows the learning flow from Foundation through Advanced. Each level adds to the previous one, and the agenda stops at the current page level. Day counts are for corporate (day-wise) delivery; live online batches cover the same agenda in max 8 to 10 hours.
Foundation Level: observability concepts: logs, metrics, traces, alertingDay 1
- What is observability: monitoring versus observability, known unknowns and unknown unknowns
- Why observability is important: faster detection and recovery (MTTD, MTTR) in cloud-native systems
- Key concepts and terminology: telemetry, signals, cardinality, golden signals, SLIs and SLOs
- Logging overview and types of logs: application, system, access, audit and security; structured vs plain text
- Log collection, aggregation, analysis and visualization: agents, shippers, central stores and log queries
- Metrics overview and types of metrics: counters, gauges, histograms and summaries; RED and USE methods
- Metric collection, storage, analysis and visualization: pull vs push, time-series databases and dashboards
- Tracing overview and types of traces: distributed traces, spans, context propagation, client and server spans
- Trace collection, storage, analysis and visualization: collectors, trace backends and waterfall views
- Alerting overview: symptom versus cause alerts, thresholds, routing, on-call and alert fatigue
- Best practices for implementing observability: instrumentation standards, naming and retention
- Popular observability tools and frameworks: OpenTelemetry, Prometheus, Grafana, Loki, Jaeger, Elastic and APM suites
- Case studies: examples of successful observability implementations, with Q&A and discussion
Essential Level = Foundation + OpenTelemetry instrumentation and Grafana stack setupDay 2 · 2 days cumulative
- OpenTelemetry architecture: API, SDK, OTLP protocol, Collector and semantic conventions
- Auto-instrumentation: the Java agent, Python opentelemetry-instrument, and Node.js and .NET options
- Manual instrumentation: creating spans, attributes, events and custom metrics in code
- OpenTelemetry Collector: receivers, processors, exporters and pipelines in the contrib distribution
- Prometheus metrics: scrape configs, node_exporter and PromQL rate, sum by and histogram_quantile
- Grafana Loki logs: the Grafana Alloy agent, labels, LogQL queries and line filters
- Grafana Tempo traces: OTLP ingestion, TraceQL search and service graphs
- Grafana dashboards: data sources, panels, variables and dashboard JSON kept in Git
- Correlating signals: trace IDs in logs, exemplars and jumping from metrics to traces to logs
- Kubernetes telemetry: kube-state-metrics, cAdvisor, Kubernetes events and pod logs
- On-call dashboards: RED and USE views per service and avoiding vanity panels
- Team conventions: service.name and resource attributes, ownership labels and dashboard reviews
Intermediate Level = Essential + alerting, SLOs, automation and troubleshootingDay 3 · 3 days cumulative
- Alerting with Alertmanager and Grafana Alerting: rules, labels, routing trees, silences and inhibition
- SLIs and SLOs in practice: availability and latency SLIs, error budgets and multi-window burn-rate alerts
- Incident response: on-call rotations, escalation, runbooks linked from alerts and PagerDuty integration
- Collector processing: batch, memory_limiter, attributes, filter and redaction processors
- Kubernetes deployment: OpenTelemetry Operator, DaemonSet and gateway Collectors, kube-prometheus-stack
- Observability as code: Grafana provisioning, the Terraform Grafana provider and PrometheusRule resources
- Troubleshooting workflow: from alert to dashboard to trace to log, isolating slow dependencies
- Continuous profiling: Grafana Pyroscope and eBPF-based CPU and memory profiles
- Synthetic and real user monitoring: blackbox_exporter probes, Grafana k6 checks and Faro browser telemetry
- Security basics: PII redaction, TLS for OTLP and access control on dashboards and data sources
- Middleware telemetry: exporters for MySQL, PostgreSQL, Redis and Kafka, and query latency insights
- Telemetry quality: cardinality control, label hygiene and dropping noisy logs and metrics
Advanced Level = Intermediate + scale, cost, reliability and observability governanceDays 4-5 · 5 days cumulative
- Scaling metrics: Grafana Mimir or Thanos for long-term, highly available Prometheus storage
- Scaling logs and traces: Loki and Tempo in microservices mode with object storage and retention
- High availability: Prometheus HA pairs, Alertmanager clustering and the Collector load-balancing exporter
- Sampling strategy: head versus tail sampling, probability sampling and its cost impact
- Cost management: telemetry volume budgets, adaptive metrics, tiered retention and cost per signal
- eBPF observability: zero-code instrumentation with Grafana Beyla or OpenTelemetry eBPF, and Cilium Hubble
- AIOps and anomaly detection: baselines, outlier detection, alert correlation and noise reduction
- Multi-tenant observability: tenant isolation, per-team limits and federated views for platform teams
- Governance: organisation standards for semantic conventions, instrumentation libraries and review gates
- Vendor strategy: OpenTelemetry to avoid lock-in, routing to several backends and agent migrations
- Reliability testing: verifying alerts and dashboards with fault injection and game days
- Capstone: an end-to-end observability platform for a microservices app with SLOs and runbooks
Choose live training or a full year of self-paced access.
If someone buys Foundation, Essential, Intermediate or Advanced as self-paced video, the price stays the same and access is granted to all four levels by default.
Self-paced video subscription
Billed yearly at ₹9,996. This includes all four levels, complete LMS access for one year, plus 20+ additional courses and 50+ tools access.
- All four Obserbability levels in one price.
- 20+ additional courses and 50+ tools included, even when subscribing to one course.
- Best fit for learners who want full-library access and flexible progress.
Live & Interactive session
Instructor-led cohort, max 8 to 10 hours, with demos, labs, Q&A, assignments and practical review.
- Live small-batch cohort from soon.
- Interactive discussion and lab troubleshooting.
- Recommended for teams that need guided implementation.
1:1 Live training
The same agenda, taught one-to-one by the trainer. Start immediately, without waiting for the next batch. Max 8 to 10 hours, one-to-one.
- Start immediately: no waiting for the monthly batch.
- One learner, one trainer: full attention on your questions.
- Sessions planned around your working hours.
- Your pace, with examples from your own projects and tools.
Method of training and assessment.
The course emphasizes practical demonstration, hands-on labs and assignment-based validation instead of passive lecture-only learning.
| SL | Method of training and assessment | Weightage |
|---|---|---|
| 1 | Understanding the problem space | 5% |
| 2 | Concept discussion | 10% |
| 3 | Live demo and walkthrough | 25% |
| 4 | Lab and hands-on exercises | 50% |
| 5 | Assignments and evaluation | 10% |
Labs, exercises and real workflow practice.
Every level moves from explanation to hands-on practice, review and troubleshooting.
Explore logs, metrics and traces
Run a small demo application and use its logs, metrics and traces side by side to answer a real troubleshooting question.
Instrument an app with OpenTelemetry
Instrument a multi-service app with OpenTelemetry, route telemetry through a Collector to Prometheus, Loki and Tempo, and build a correlated Grafana dashboard.
Build SLO alerts and runbooks
Define SLOs for a service, create burn-rate alerts routed through Alertmanager and resolve an injected latency fault using traces and logs.
Scale an observability platform
Deploy Mimir, Loki and Tempo on object storage, apply tail sampling and retention policies, and produce a telemetry cost report.
Obserbability is taught as part of a working delivery ecosystem.
You learn where the tool sits in the wider engineering workflow, not in isolation.
Core foundations
Terminology, concepts, architecture and the operating model behind the tool.
Workflow traceability
Map practical work to tasks, approvals, documentation and delivery visibility.
Automation and integration
Use Obserbability with validation checks, automation hooks and delivery workflows.
Governance controls
Operate with permissions, approvals, policy checks and production-safe workflows.
How your practical work is assessed.
Your certificate is backed by labs, assignments, capstone thinking and completion evidence.
Assignments
Level-specific assignments verify setup, configuration, workflow quality and operating discipline.
Hands-on validation
Learners are expected to complete practical usage, automation and troubleshooting exercises.
Completion record
Certificate issuance is tied to demonstrated participation, practical completion and course-level coverage.
Led by Rajesh Kumar and the DevOpsSchool practitioner network.
Training is grounded in practical DevOps, SRE, security, release and platform engineering experience with real enterprise delivery context.
Earn a DevOpsSchool Obserbability certificate.
Completion includes a digital certificate with credential details, practical assignments and a learning record aligned to the selected Obserbability level.
Certificate verificationCertificate of Completion
Obserbability Advanced Training
Unique credential ID, verifiable online
What learners say about training with Rajesh Kumar.
“Rajesh is very good trainer. Rajesh was able to resolve our queries and question effectively. We really liked the hands-on examples covered during this training program.”
“Very well organized training, helped a lot to understand the AWS concept and detailed related to various tools. Very helpful”
“The training was very useful and interactive. Rajesh helped develop the confidence of all.”
Rated 4.6 on Google · All testimonials · Video reviews on YouTube
Quoted as published, from learners in Rajesh Kumar's live trainings across DevOpsSchool courses.
Used by developers, DevOps engineers, release leads and engineering managers.
Private batches are available for teams that want the same agenda aligned to their own tools and workflows.
Why this Obserbability path is different.
The value is not only one course. The subscription unlocks the full learning ecosystem for one year.
| Feature | DevOpsSchool Obserbability Training | Typical short course |
|---|---|---|
| Levels | Foundation, Essential, Intermediate, Advanced | Single generic syllabus |
| Self-paced access | All four levels plus 20+ courses and 50+ tools | Usually one course only |
| Live training | Demos, labs, Q&A and assignment review | Often lecture-heavy |
| Certificate | DevOpsSchool completion certificate | Varies by provider |
Questions learners ask before joining.
Does Foundation cost less than Advanced?
No. Self-paced pricing is intentionally the same because access includes all four levels by default.
What is included in the yearly subscription?
One year of complete LMS access, all four levels for the selected course, plus 20+ additional courses and 50+ tools access.
Can corporate teams request customization?
Yes. The live format can be aligned to team tools, governance requirements, workflows and internal delivery standards.
What is the recommended sequence?
Foundation → Essential → Intermediate → Advanced. The agenda is designed so each level builds on the previous one.
Talk to DevOpsSchool before choosing the batch.
Use this support section for batch questions, corporate planning, LMS access clarifications, or guidance on which Obserbability level fits your team.
India / Worldwide: +91 99057 40781
USA: +1 (469) 756-6329
Email: contact@DevOpsSchool.com
Chat on WhatsAppExtend the course with articles, explainers and workflow guidance.
Continue learning with supporting articles that connect Obserbability practices to DevOps, automation, governance and delivery workflows.
Training snapshots and certificate preview.
A look at the completion certificate and the course.
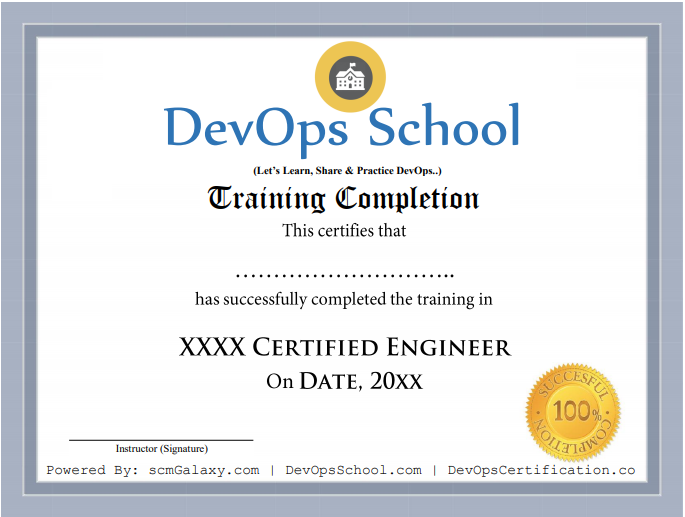
Certificate preview
See what course completion evidence looks like.
Tool-focused training
Course visuals reinforce the Obserbability workflow and subject area.
Live batch experience
Training supports live online, private team and workshop-style delivery.
Start Obserbability Advanced training.
Next weekday batch starts on the 1st; weekend batch on the first Saturday. Batches are capped at 10 learners. Send your details and DevOpsSchool will share the syllabus and batch options.