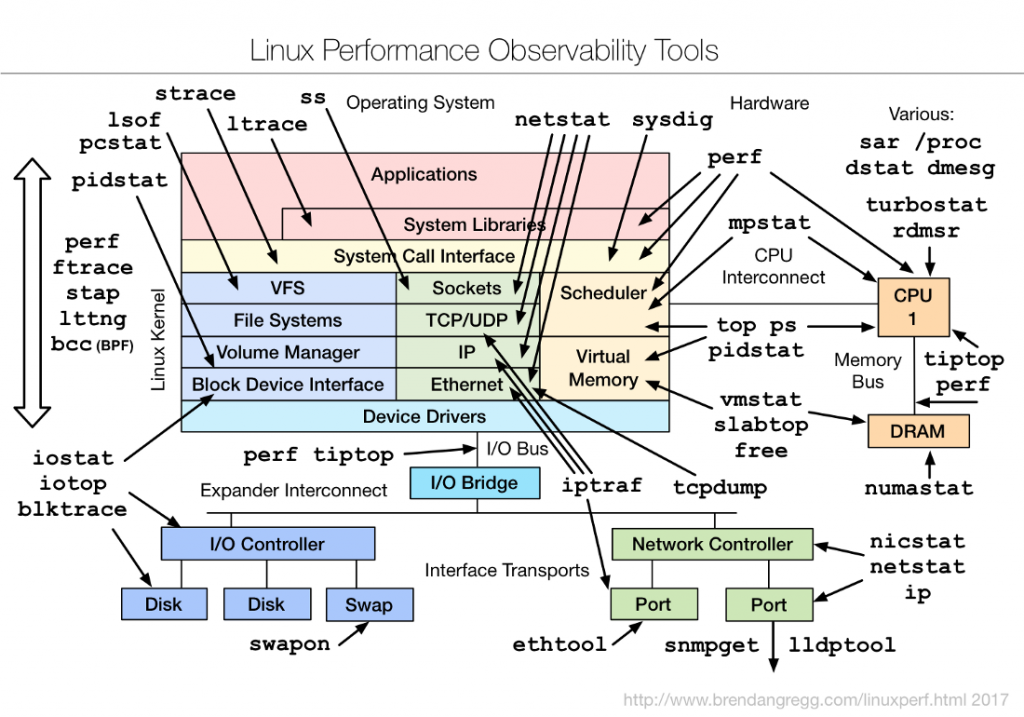
 mpstat - Report processors related statistics.

The mpstat command writes to standard output activities for each available processor, processor 0 being the first one.  Global average activities among all processors are also reported.
How to install mpstat?
$ sudo apt install sysstat         [On Debian, Ubuntu and Mint]
$ sudo yum install sysstat         [On RHEL/CentOS/Fedora and Rocky Linux/AlmaLinux]
$ sudo emerge -a app-admin/sysstat [On Gentoo Linux]
$ sudo pacman -S sysstat           [On Arch Linux]
$ sudo zypper install sysstat      [On OpenSUSE]
mpstat command output
Understanding mpstat output
- CPU : Processor number. The keyword all statistics are calculated as averages among all processors.
- % usr : Show the percentage of CPU utilization that occurred while executing at the user level (application).
- % nice : Show the percentage of CPU utilization that occurred while executing at the user level with nice priority.
- % sys : Show the percentage of CPU utilization that occurred while executing at the system level (kernel). Note that this does not include time-consuming servicing hardware and software interrupts.
- % iowait : The CPU or CPUs were idle during which the system had an outstanding disk I / O request.
- % irq : Show the percentage of time spent by the CPU or CPUs to service hardware interrupts.
- % soft : Show the percentage of time spent by the CPU or CPUs to service software interrupts.
- % steal : Show the percentage of time spent waiting for the CPU or CPUs while the hypervisor is servicing another virtual processor.
- % guest : Show the percentage of time used by the CPU or CPUs to run a virtual processor.
- % idle : The CPU or CPUs were idle and the system did not have an outstanding disk I / O request.
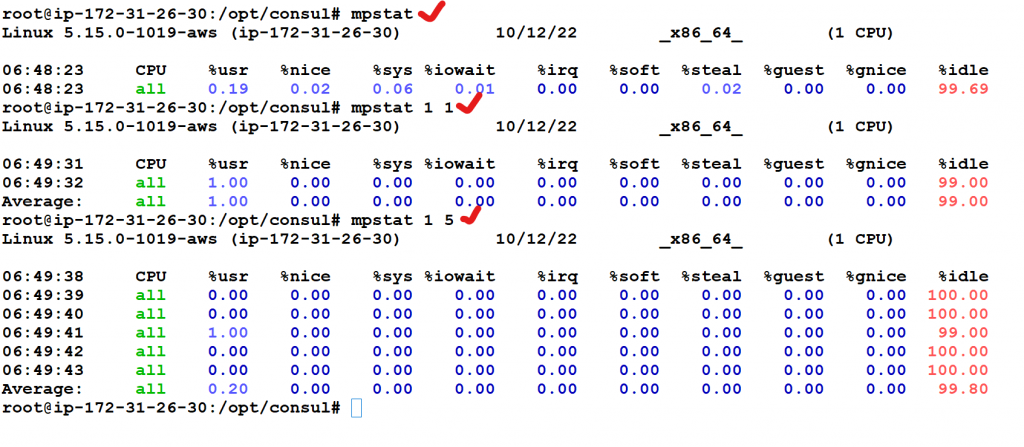
mstat commands example
1. To report the processor stats:
# mpstat 2 10
2. To report all processor stats:
# mpstat -A 2 10
3. To get the processor number for which the stats are displaying:
# mpstat -P 2 10
4. To report the CPU utilization stats:
# mpstat -u 2 10
5. To get the version info:
# mpstat -V

To see the default set of utilization metrics, enter the following command:
mpstat 1 1

To see the default set of utilization metrics in wide display mode, enter the following command:
mpstat –w 1 1

To see the detailed dispatch & affinity metrics, enter the following command:
 mpstat –d 1 1

To see the detailed interrupts report, enter the following command:
mpstat –i 1 1

To see all the statistics, enter the following command:
mpstat –a 1 1

To see simultaneous multithreading utilization, enter the following command:
mpstat –s 1 1

To see all the processor metrics of a WPAR, enter the following command:
mpstat -@ wparname

Note: To see all the processor metrics of a WPAR inside the WPAR, enter the following command:
mpstat -@

To see the sorted output for the column cs, enter the following command:
mpstat -d -O sortcolumn=cs

To see the list of the top 10 CPUs, enter the following command:
mpstat -a -O sortcolumn=min,sortorder=desc,topcount=10

To see metrics based on the virtual processor, enter the following command:
mpstat –v
Context
I’m Rajesh Kumar, a DevOps, SRE, DevSecOps, Cloud, and Platform Engineering expert passionate about sharing practical knowledge, real-world experiences, and industry best practices. I have worked at Cotocus and regularly write about technology, travel, investing, health, product reviews, and digital marketing through my various platforms.
I publish technical articles at DevOps School, travel stories at Holiday Landmark, stock market insights at Stocks Mantra, health and fitness guidance at My Medic Plus, product reviews at TrueReviewNow, and SEO and digital marketing strategies at Wizbrand.
Find Trusted Cardiac Hospitals
Compare heart hospitals by city and services — all in one place.
Explore Hospitals