Continous application profiling helps you analyze and compare code performance at any time and in any environment, including production, with negligible overhead. Proactively analyze and optimize your application code in order to improve MTTR, enhance user experience, and reduce cloud provider costs with the Continuous Profiler.
Datadog Continuous Profiler analyzes and compares code performance all the time and in any environment, including production, with negligible overhead. Quickly identify and optimize the most time- and resource-consuming parts in your application code in order to improve MTTR, enhance user experience, and reduce cloud provider costs.
Datadog offers a continuous profiling service that can discover lines of code that have the highest CPU usage or memory allocation. For example, the following figure (a flame graph) displays the time each method spent executing on the CPU:
Pinpoint hard to replicate production issues caused by inefficient code
- Continuously profile each line of code in any environment without affecting application performance and user experience
- Identify methods that are inefficient under production load, despite having performed well in pre-production environments
- Optimize resource consumption and save on compute costs with code profiling aggregations across hosts, services, and versions
Method-level visibility into every request
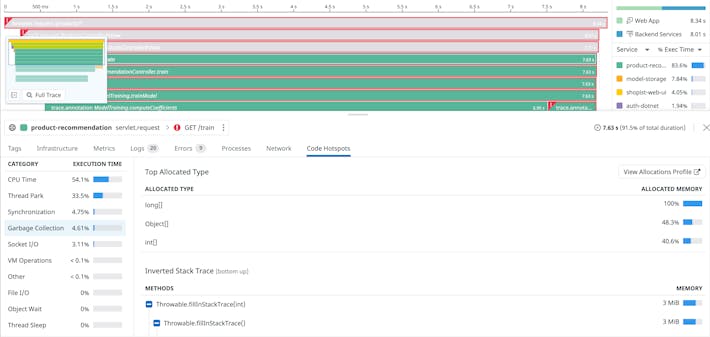
- Tie every distributed trace in APM to the performance of methods and threads that executed the request
- Determine the root cause of slow requests with a breakdown of time spent by method on garbage collection, locks, and I/O
- Resolve service bottlenecks and improve user experience by optimizing the methods that are causing high latency
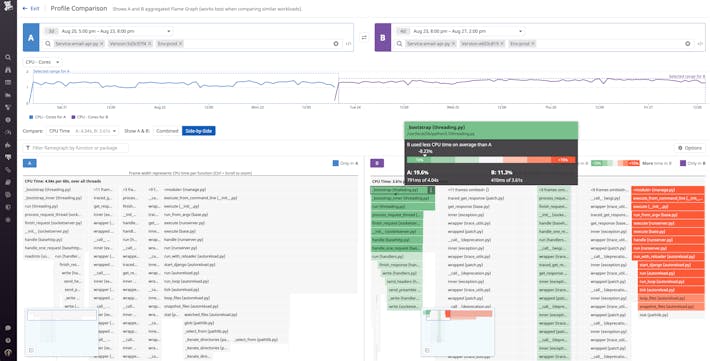
Track every deploy and eliminate code performance regressions
- Compare a variety of profile types to analyze the performance impact of new code during canary, blue/green, or shadow deploys
- Isolate the most resource-heavy methods to quickly understand what is causing a spike in latency, CPU utilization, or memory allocation
- Monitor code performance variations in production by applying code profiling metrics to your dashboards
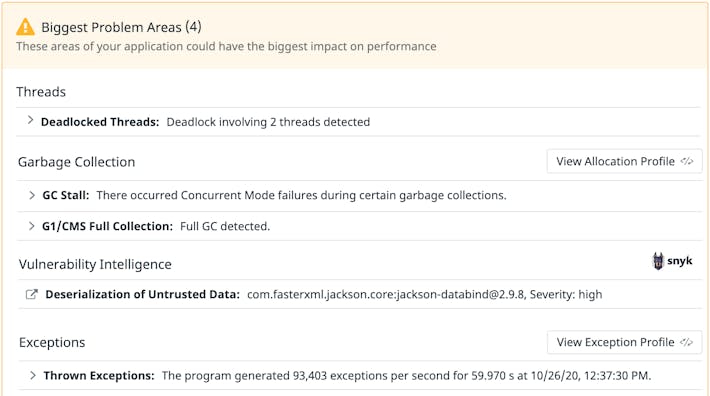
Automated code profiling insights, leveraging years of runtime expertise
- Derive actionable insights from an automatic heuristic analysis of the main problem areas in your code
- Surface runtime performance problems such as deadlocked threads, inefficient garbage collection, and memory leaks
- Apply suggested fixes to improve application performance without having prior experience in code profiling
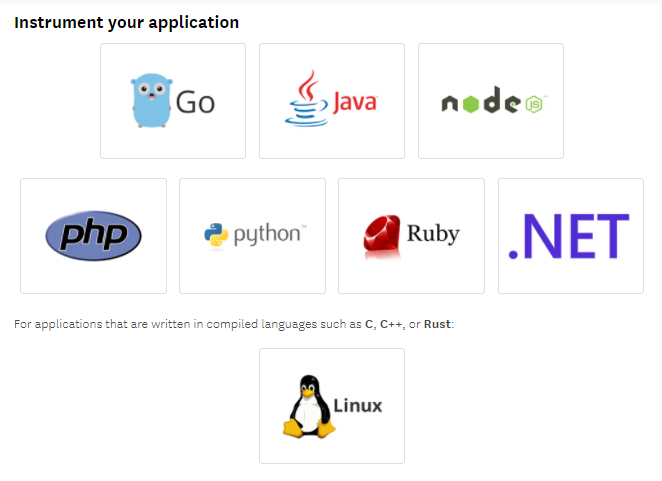
Datadog Support following Language for Profiling
Getting started
Getting Started with the Continuous Profiler
https://docs.datadoghq.com/getting_started/profiler/
APM & Continuous Profiler
https://docs.datadoghq.com/tracing/
Datadog Releases Continuous Profiler For Low-Overhead Application Code Profiling
https://www.datadoghq.com/about/latest-news/press-releases/continuous-profiler/
Enabling the Profiler
https://docs.datadoghq.com/tracing/profiler/enabling/
Deploy continuous application profiling
Improve service performance with always on application profiling.
- Gain full visibility into the performance of your application code in production, with minimal overhead and at all times
- Quickly find the most time-consuming parts of your code with a breakdown of application profiling data for every distributed request
- Optimize your application’s code and user experience by analyzing wall time, lock, socket I/O, and file I/O code profiles
Proactively profile application performance
Optimize CPU utilization, improve memory allocation, and save on compute costs
- Reduce cloud costs by detecting and optimizing the methods in your production code that consume the most CPU and memory
- Leverage CPU and memory profile aggregation across hosts, services, and code versions to optimize the resource consumption in production
- Track CPU and memory consumption by method over time and compare application profiles to quickly explain performance regressions after code deployments
Get complete visibility into code-level performance
Put profiling data in context to gain a deeper understanding of your application performance.
- Analyze 100% of your code in production including methods, classes, and threads across your entire stack
- Seamlessly pivot between data from application profiling and distributed tracing with 1-click to identify the most resource-intensive requests
- Get deeper insights into exceptions, garbage collection, I/O, locks, and packages with continuous observability and category breakdowns such as code cache, class loading, and heap size

I’m Rajesh Kumar, a DevOps, SRE, DevSecOps, Cloud, and Platform Engineering expert passionate about sharing practical knowledge, real-world experiences, and industry best practices. I have worked at Cotocus and regularly write about technology, travel, investing, health, product reviews, and digital marketing through my various platforms.
I publish technical articles at DevOps School, travel stories at Holiday Landmark, stock market insights at Stocks Mantra, health and fitness guidance at My Medic Plus, product reviews at TrueReviewNow, and SEO and digital marketing strategies at Wizbrand.
Find Trusted Cardiac Hospitals
Compare heart hospitals by city and services — all in one place.
Explore Hospitals