What is JMX?
Java Management Extensions (JMX) is a Java technology that supplies tools for managing and monitoring applications, system objects, devices and service-oriented networks. Those resources are represented by objects called MBeans. In the API, classes can be dynamically loaded and instantiated.
JMX monitoring can be used to monitor JMX counters of a Java application.
JMX monitoring has native support in Zabbix in the form of a Zabbix daemon called “Zabbix Java gateway”, introduced since Zabbix 2.0.
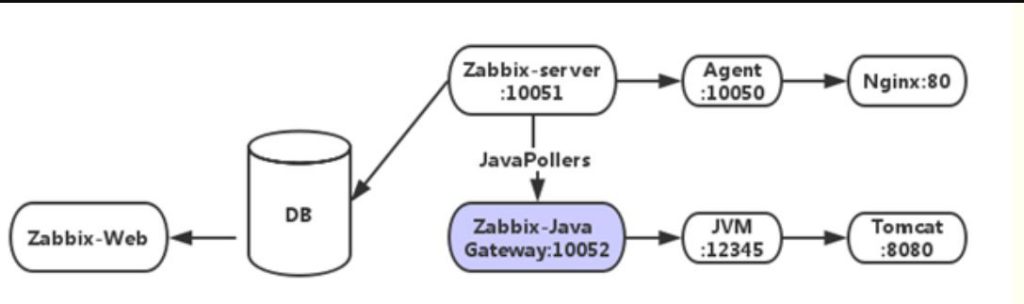
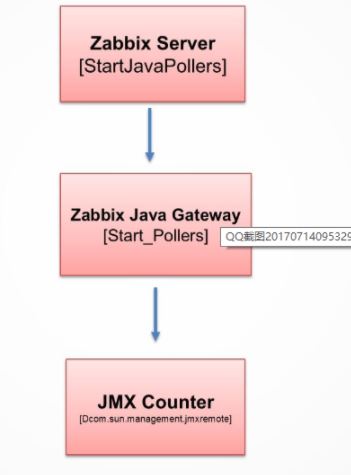
To retrieve the value of a particular JMX counter on a host, Zabbix server queries the Zabbix Java gateway, which in turn uses the JMX management API to query the application of interest remotely.
Zabbix Java gateway
The so-called Zabbix Java Gateway is a special bollard process that can retrieve data via JMX. Unlike the previously mentioned boll processes, this is not an “internal” process within the Zabbix server. The Java Gateway is a stand-alone daemon that provides data to the Zabbix server through a TCP port. The Java Gateway is Java software that requires a JRE.
How Zabbix-Server Monitor Java Apps using JMX?
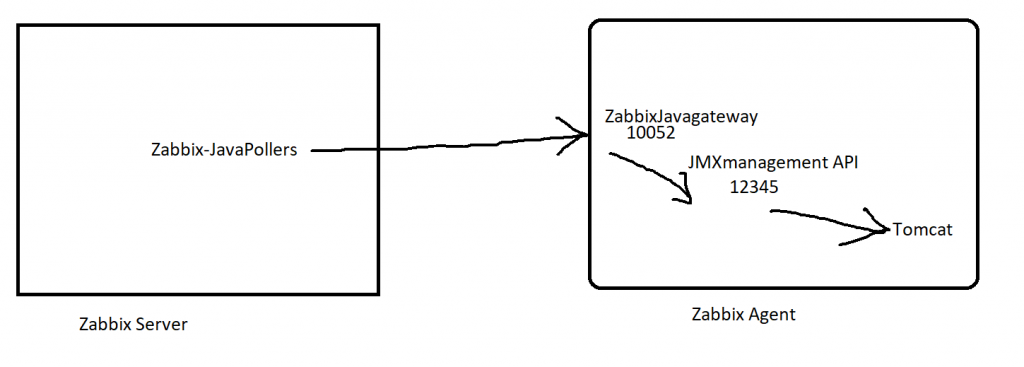
When Zabbix-Server needs to know a performance of a Java application, it starts its own Zabbix-JavaPollers process to connect to Zabbix-JavaGateway requesting data, and ZabbixJavagateway receives the request and uses the JMXmanagement API to query a specific application, provided that the application requires’-Dcom.sun.management.jmxremo’when it startsTe”parameter to open JMX remote queries.The Java program starts its own simple applet port 12345 to provide the requested data to Zabbix-JavaGateway.
From the schematic diagram above, you can see that the key points to configuring Zabbix monitoring Java applications are configuring Zabbix-JavaGateway, enabling Zabbix-Server to connect to Zabbix-JavaGateway, Tomcat to turn on JVM remote monitoring capabilities, and so on.
Prerequisite
Step 1 – Locate a VM where you want to run JAVA Application & Install JAVA
Step 2 – Install and Verify Tomcat
$ apt install unzip wget
$ cd /opt/
$ wget https://apachemirror.wuchna.com/tomcat/tomcat-8/v8.5.66/bin/apache-tomcat-8.5.66.zip
$ unzip apache-tomcat-8.5.66.zip

# Tomcat 9 Install Guide

$ /opt/
$ wget https://dlcdn.apache.org/tomcat/tomcat-9/v9.0.60/bin/apache-tomcat-9.0.60.zip
$ yum install unzip
$ unzip apache-tomcat-9.0.60.zip
$ cd apache-tomcat-9.0.60
$ cd bin/
$ chmod -R 775 *
$ ls -la
$ ./startup.sh
$ ps -eaf | grep tomcat

Code language: PHP (php)
Step 3 – Install and Verify Sample Apps in Tomcat
$ cd /opt/apache-tomcat-8.5.66/webapps
$ wget https://tomcat.apache.org/tomcat-7.0-doc/appdev/sample/sample.war
$ chmod 755 sample.warCode language: JavaScript (javascript)
Step 4 – Enable JMX in Tomcat
Enabling remote JMX monitoring for Java application in Zabbix Agent Where Java Apps is installed

A Java application does not need any additional software installed, but it needs to be started with the command-line options specified below to have support for remote JMX monitoring.

As a bare minimum, if you just wish to get started by monitoring a simple Java application on a local host with no security enforced, start it with these options:

$ cd /opt/apache-tomcat-8.5.66/bin
$ vi setenv.sh
export CATALINA_OPTS="$CATALINA_OPTS -Dcom.sun.management.jmxremote -Dcom.sun.management.jmxremote.port=12345 -Dcom.sun.management.jmxremote.ssl=false -Dcom.sun.management.jmxremote.authenticate=false -Djava.rmi.server.hostname=52.66.202.226 -Djava.net.preferIPv4Stack=true"
$ chmod -R 755 .
$ ./startup.sh
$ ps -eaf | grep tomcat
$ ps -eaf | grep jmx
$ netstat -nl | grep -E -i "proto|8080|12345"
# Verify http://IP-ADD:8080/sample/

NOTE:
- java.rmi.server.hostname = A Place where JMX is running and accessible. Ie. Tomcat server

- Communication between Java gateway and the monitored JMX application should not be firewalled. So disable the server level internal firewall in the linux client using the below command. $ systemctl disable firewalld

OR
java \
-Dcom.sun.management.jmxremote \
-Dcom.sun.management.jmxremote.port=12345 \
-Dcom.sun.management.jmxremote.authenticate=false \
-Dcom.sun.management.jmxremote.ssl=false \
-Dcom.sun.management.jmxremote.registry.ssl=false \
-jar /usr/share/doc/openjdk-6-jre-headless/demo/jfc/Notepad/Notepad.jar

Code language: PHP (php)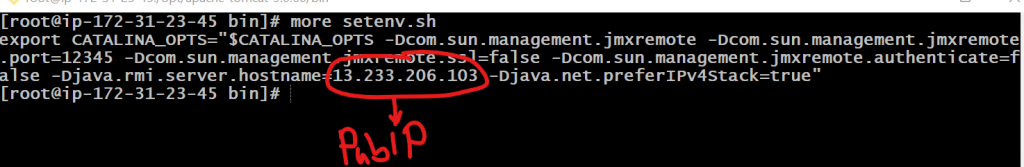
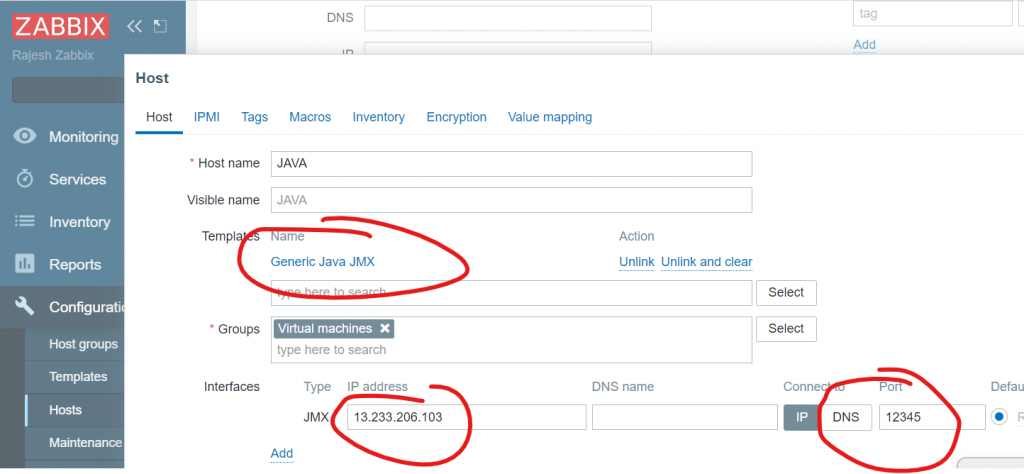
Step 5 – Configuring JMX interfaces and items in Zabbix frontend
With Java gateway running, server knowing where to find it and a Java application started with support for remote JMX monitoring, it is time to configure the interfaces and items in Zabbix GUI.
Before retrieving data from the JMX interface, you must specify for each host on which IP address and on which TCP port the JMX interface of the Java program listens. Navigate to the host configuration and add a JMX interface. If you want to monitor several Java programs via JMX on a host, you must use different TCP ports.
- Create a host at Zabbix Server with a IP address where you enabled JMX with a port – 12345
- Apply Apache Tomcat JMX template to a host
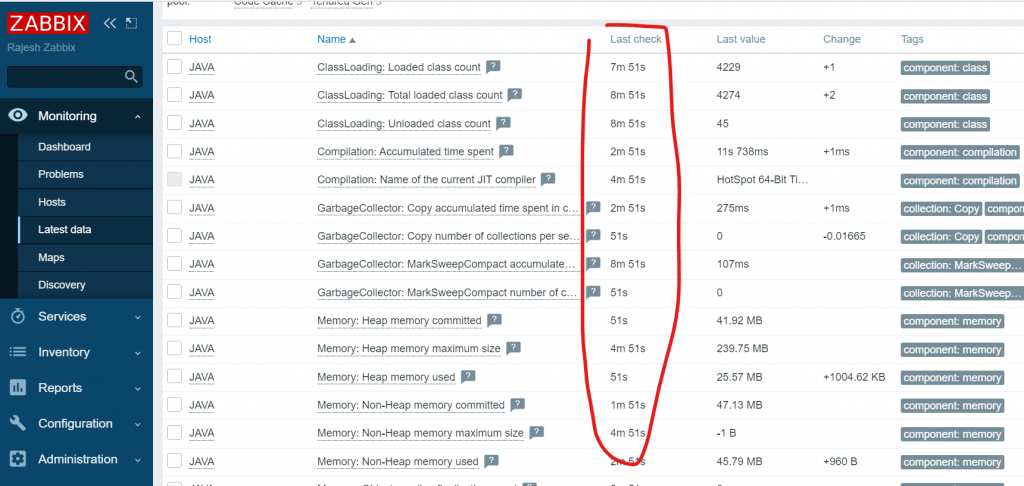
- Validate a Latest data of Of Java at Zabbix FrontEnd
Step 6 – Check the Latest Data
Reference
- https://www.zabbix.com/documentation/5.4/en/manual/concepts/java
- https://www.zabbix.com/documentation/5.4/en/manual/config/items/itemtypes/jmx_monitoring
- https://blog.zabbix.com/new-monitoring-possibilities-for-java-applications-in-zabbix-3-4/5972/
Some Rough Work
I’m Rajesh Kumar, a DevOps, SRE, DevSecOps, Cloud, and Platform Engineering expert passionate about sharing practical knowledge, real-world experiences, and industry best practices. I have worked at Cotocus and regularly write about technology, travel, investing, health, product reviews, and digital marketing through my various platforms.
I publish technical articles at DevOps School, travel stories at Holiday Landmark, stock market insights at Stocks Mantra, health and fitness guidance at My Medic Plus, product reviews at TrueReviewNow, and SEO and digital marketing strategies at Wizbrand.
Find Trusted Cardiac Hospitals
Compare heart hospitals by city and services — all in one place.
Explore Hospitals
LOL at “ So disable the server level internal firewall in the linux client using the below command. $ systemctl disable firewalld”
yeah don’t bother opening a single port for communication, just disable your entire firewall. who cares about security.