Apache is an open source, cross-platform web server distributed under the Apache License version 2.0. Because of its durability, battle-tested SSL security, and dedicated user base, it’s one of the most widely used web servers in production on the Internet. The integration is available for customers with a subscription to New Relic Infrastructure Pro.
With this integration, you can use New Relic to collect valuable performance metrics and inventory data from your Apache web servers to help you gain complete visibility into your underlying infrastructure. Metrics and inventory data are sent to Infrastructure and New Relic Insights, which include pre-built dashboards of your Apache metric data. You can also easily create alert policies and your own custom queries and charts in Insights.
You can view pre-built dashboards of your Apache metric data, create alert policies, and create your own custom queries and charts.
Critical performance and health metrics for monitoring Apache web servers
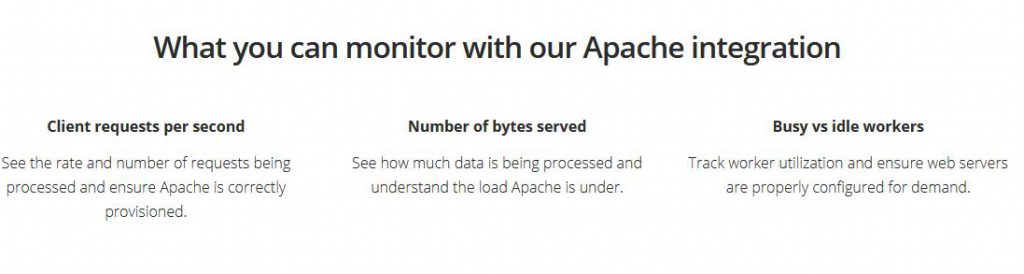
The Apache Integration captures key performance metrics and attaches them to the ApacheSample event type. Using the metrics command, the integration collects the following metric data attributes:
- Requests per second, by host
- Status of busy workers
- Total, idle, and busy workers
- Bytes sent per second, by host
- Bytes sent per request, by host
The integration’s inventory command captures the version numbers from running Apache instances and from all loaded Apache modules, using Apache’s binary file.
Compatibility and requirements
- Newrelic integration is compatible with Apache versions 2.2 or 2.4.
- Apache status module enabled and configured for Apache instance.
- Apache status module endpoint (default server-status) available from the host containing the Apache integration.
- You must have the infrastructure agent installed on a Linux OS host that’s running Apache.
- nri-apache must be installed for Apache integration
Step 1 – Install , Enable and Start HTTPD service
How to install Apache HTTD in UBUNTU and CENTOS and RHEL?
$ sudo yum install httpd
$ sudo systemctl enable httpd
$ sudo systemctl start httpd
Step 2 – Enable mod_status to Monitor Apache Web Server Load and Page Statistics
How to enable Mod_Status module in Ubunutu and CENTOS / RHEL?
How to Enable mod_status in Centos? Refer below
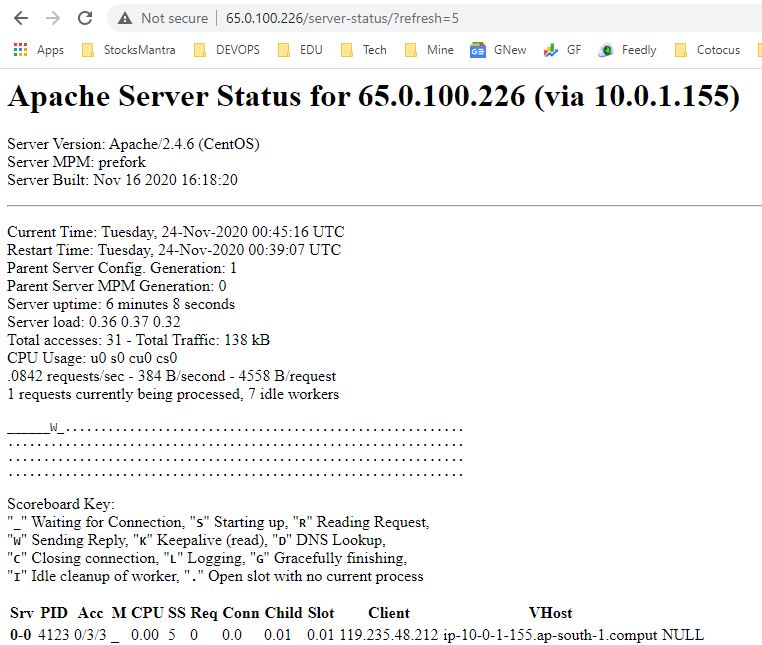
Step 3 – Verify The Apache status page will be accessible via your domain name with “/server-status” at the following URL’s.
curl http://localhost/server-status
curl http://localhost/server-status/?refresh=5
http://65.0.100.226/server-status/?refresh=5
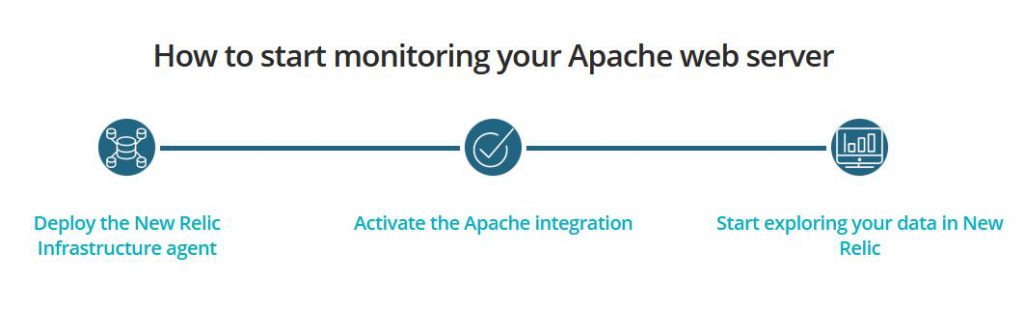
Step 4 – Install the infrastructure agent
Reference
- https://docs.newrelic.com/docs/infrastructure/install-infrastructure-agent
- https://www.devopsschool.com/blog/newrelic-infrastructure-monitoring-linux-vitural-machine-using-newrelic-agent/
- https://www.devopsschool.com/blog/newrelic-infrastructure-monitor-windows-2019-server-using-newrelic-infrastructure/
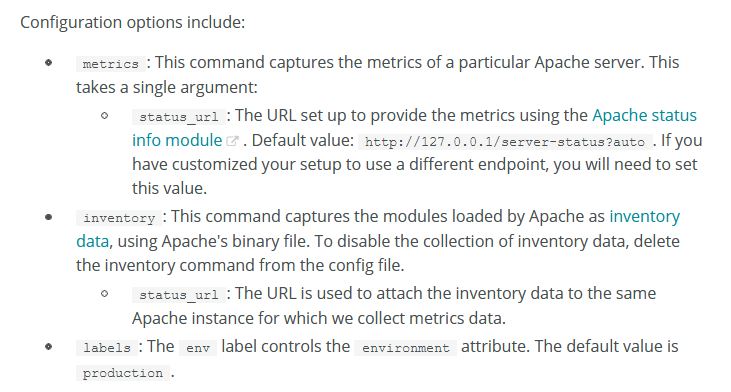
Step 5 – nri-apache must be installed for Apache integration and change apache-config.yml configuration file as mentioned below;
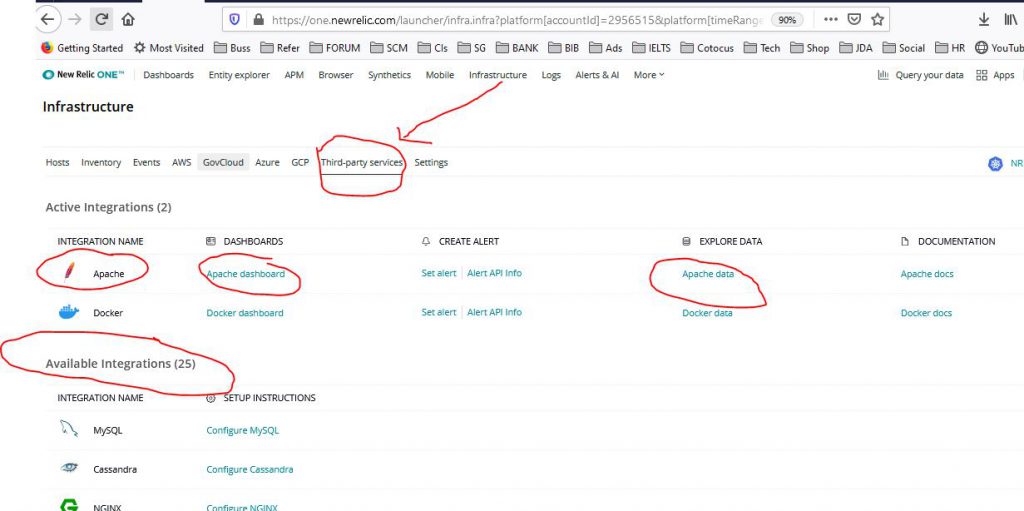
Step 6 – Integration dashboards
New Relic infrastructure integrations come with pre-built dashboards with metrics and inventory data from the monitored service.
To find your dashboards: Go to one.newrelic.com > Infrastructure and look for your service. Most on-host integrations (like NGINX, Redis, MySQL) are under Third party services.
I’m Rajesh Kumar, a DevOps, SRE, DevSecOps, Cloud, and Platform Engineering expert passionate about sharing practical knowledge, real-world experiences, and industry best practices. I have worked at Cotocus and regularly write about technology, travel, investing, health, product reviews, and digital marketing through my various platforms.
I publish technical articles at DevOps School, travel stories at Holiday Landmark, stock market insights at Stocks Mantra, health and fitness guidance at My Medic Plus, product reviews at TrueReviewNow, and SEO and digital marketing strategies at Wizbrand.
Find Trusted Cardiac Hospitals
Compare heart hospitals by city and services — all in one place.
Explore Hospitals