- What is Kibana?

Kibana is an open-source data visualization and exploration tool that is licensed by Apache and platform from Elastic that has large volumes of real-time data streaming. It can easily perform advanced-level data analysis and data visualization in a variety of charts, tables, and maps. Kibana makes it easy to understand larger volumes of data. It is a simple and browser-based interface that allows you to create and share dynamic dashboards modifications quickly to Elastic search queries in real-time.
2. state popular features of Kibana?

- Dashboard-only mode
- View surrounding documents
- Export to CSV
- User management
- Proximity events
- Cognitive insights
- Automated email notifications on elastic stack monitoring alerts
- Watcher UI for threshold-based alerts
The query which is a new query language that takes the Kibana search bar experience up a notch.
- How Kibana is related to data visualization?
Kibana is the visualization layer of the ELK stack that is the most popular log analysis platform that consists of Elastic search, Logstash, and Kibana.
4. How can you verify ELK stack?
First set up the components and keep them up for running. Then go to the application and test the endpoints twice so that logs are generated. Then go to the Kibana console and check if the logs are properly stacked in the Kibana and then you can apply filters.
5. Explain the ELK stack?
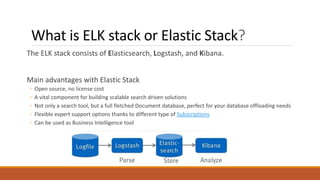
The ELK Stack includes Elasticsearch, Logstash, and Kibana. Though they have been used together and each one is a separate project driven by an open-source vendor known as Elastic. It has become a full service of the ELK stack. It has been adopted widely among the organizations for the analysis purposes and has been the primary driver of its popularity.
6. State an example of use cases of Elasticsearch?
You can run an online web store where you can allow your customers to search for the products that you sell. Here, Elasticsearch can be used to store your entire product catalog and inventory and provide search and autocomplete suggestions for your users.
7. State advantages of Kibana?
- Contains open-source program based visualization tools fundamentally used to break down large volumes of logs as line diagrams, bar graphs, pie charts, heat maps, and so forth.
- Straightforward and simple for fledglings to comprehend.
- The simplicity of change of representation and dashboard into reports.
- Canvas visualization helps to dissect complex information in a simple manner.
- Timelion perception in Kibana assists with contrasting data in reverse with comprehending the exhibition better.
- What are the components of the ELK stack?
- Elastic search: It is used to store all of the applications and monitoring logs.
- Logstash: The server component that processes incoming logs and feeds them to elasticsearch.
- Kibana: A web interface for searching and visualizing logs.
- What are the primary components of the Kibana interface?
Kibana has four primary components:
- Discover
- Visualize
- Dashboard
- Settings
- Explain the Kibana Discover Interface?
When you will start discovering Kibana, you will be taken to the Discover web page by default as this will show your ELK stack’s maximum received logs.
- Explain the Kibana dashboard?
The Kibana Dashboard page is in which you may make, adjust, and take a gander at your own custom dashboards. With a dashboard, you can coordinate several perceptions onto a solitary website page, at that point channel them by means of giving a hunt question or through choosing channels through clicking factors inside the representation. Dashboards are useful for while you need to get a high-level perspective on your logs and make relationships among various perceptions and logs.
- How can you utilize Kibana?
A tool named Logstash is used for collecting and storing logs. Kibana provides a web interface that enhances the search results and views the logs indexed by Logstash. Kibana is written in JavaScript.
13. How can you create a Kibana Dashboard?
- Kibana dashboard can be created, firstly by clicking over the menu item of the dashboard. Then click add visualization icon and follow the process-
- Select ‘log count’ pie chart & ‘Nginx’ histogram.
- Collapse Add Visualization menu.
- You can rearrange the visuals over the dashboard.
- Click on save dashboard icon
14. How can you define the Kibana Docker image?
The images are available in two different flavors that are X- pack flavor and Oss flavor. X-pack is the default one which is pre-installed. Though, Oss flavor has no interference with X-pack and host but only open source Kibana.
15. Explain X-pack and a replica in Kibana?
The elastic stack extension is followed by a bundle of security and monitoring components all into an easily installed package. It also monitors, alerts, and reports the segments. When the index is broken into shards and then gets sequentially divided forming replicas. Replicas are basically copies of shards. They are scaled by index.
- Explain Kibana port and Kibana.yml file/ State the relationship between Kibana port and Kibana.yml file?
On the localhost 5601, the entirety of the default settings are configured to run Kibana. So as to change the port number or make an association with Elasticsearch introduced on another machine, you need to refresh the kibana.yml record. With the startup, Kibana workers began perusing the properties of the kibana.yml document.
- Explain the term clustering?
It is basically an entire collection of multiple servers altogether which beholds the data. It also provides indexing and search liabilities through the service and this cluster is identified by the name ‘Elasticsearch’.
- Can you explain Kibana settings?
Kibana setting is a page that allows a user to make modifications like index patterns and values. It also includes object selection modifications.
19. What, in your thought, Kibana visualize interface is?
A complete platform to modify the customs and change them according to the desires is provided by Kibana visualize interface. This includes bars to Pie Charts and data tables.
20. What is Kibana.yml?
The Kibana server reads properties from the kibana.Yml record on startup. To trade the host or port quantity, or hook up with Elasticsearch walking on a one of a kind gadget, you’ll need to replace your kibana.Yml record. You can also permit SSL and set a variety of different alternatives.
21. Which are the operations can be performed on a document using Elasticsearch?
Following are the operations which could be performed over documents using Elasticsearch-
- Indexing
- Fetching
- Updating
- Deleting
22. Can you define node?
In terms of technical language node is always referred to as a single server or system which is a part of a cluster. It also stores data and anticipates the search capabilities of Server.
23. Is Elasticsearch a Nosql DB?
Elasticsearch is a full-text, distributed NoSQL database. In other words, it uses documents rather than schema or tables. It’s a free, open source tool that allows for real-time searching and analyzing of your data.
24. What is meant by shards in Elasticsearch?
Elasticsearch enables you to split the index using shards, which are smaller portions of the index. Each shard is a comprehensive integrated and conscious “index” that can be stored on any cluster node. Elasticsearch ensures redundancy by redistributing documents in an index throughout many shards and those shards across numerous nodes, which provides against component failure while also increasing query capacity when nodes are deployed to a cluster.
25. Explain about Kibana Lens?

Kibana Lens is a designed tool that allows both expert and inexperienced users to have quick access to the information insights. The lens is indeed a drag-and-drop UI interface to make analyzing Elasticsearch data and creating visuals easier. The lens makes it easier to make charts by suggesting various ways to show data implemented in data analysis and typical usage patterns.
A user can do the following with Kibana Lens:
- With minimal program involvement, browse the data in an Elasticsearch index.
- Create many data visualizations by dragging and dropping data fields.
- Search across many Elasticsearch indices at the same time for evaluation in the same visualization.
- Switch aggregations and chart types in real-time to create data visualizations.
- Kibana allows you to create interactive dashboards without coding or prior training.
26. Describe Kibana Canvas?
Within Kibana, Canvas provides a visual and reporting application. Live data from Elasticsearch may be blended with text, colors, photos, and other configurable features to create animated, multi-page slideshows with Canvas.
A user can do the following with Canvas:
- Make a workplace your own by adding fonts, borders, backgrounds, colors, and many more.
- Add custom visuals to work pads, such as texts and images.
- Pull data directly from Elasticsearch to customize it.
- Data can be shown using progress monitors, graphs, charts, and other tools.
- Filters help you stay focused on the data you want to display.
27. Explain about Elastic Machine learning features?
Elastic machine learning features simulate the behavior of your Elasticsearch information in real-time, including periodicity, trends, and more, to spot vulnerabilities quickly, accelerate root cause investigation, and eliminate false alarms. Following are the Elastic Machine Learning Features:
Alerting on anomalies: Combine monitoring with unsupervised machine learning characteristics to detect unusual activity that is difficult to characterize using guidelines and regulations. Then, when difficulties arise, use the anomalies values in the monitoring framework to be warned.
Population/Entity Analysis: This feature allows you to create a profile of what a “standard” client, device, or other entity performs over a set period, and then discover exceptions when their behavior deviates from the norm.
Log Message Categorization: The data in application log events are frequently fragmented and changeable. The static sections of the message are observed by elastic machine learning characteristics, which cluster consistent messages together and categorize them into message segments.
Root cause Indication: Elastic machine learning characteristics make it simple to determine the properties that greatly influenced an anomalous once it has been recognized. For example, if there’s a sudden decline in operations, you can rapidly pinpoint the cause to a defective server or a mismatched switch that is causing the issue.
Data Visualizer: Data Visualizer analyzes the statistics and attributes in a file system or an existing database helps you to explain the Elasticsearch data and discover new areas for machine learning study.
Inference: Inference allows you to employ guided machine learning methods like classification or regression continuously rather than just as a batch analysis. Inference enables the application of developed machine learning methods to data received.
Language identification: A classification model for identifying the language of textual content. In an inference processor, you can use the language systems that are classified as a reference.
Model snapshots Management: In the event of an unanticipated disruptive event or other incidents that cause false anomalous detection results, quickly revert a prototype to the intended snapshot.
Anomaly detection on time series: Create reliable frameworks of acceptable behavior in the data to discover deviant anomalies in that data to automate the evaluation of time series data. Using innovative machine learning techniques, inconsistencies are recognized, rated, and linked to highly significant variables in the data.
- Anomalies in statistics, numbers, or frequencies occur over time.
- Rarity in statistics
- Unusual activity in a population member
28. Explain about Kibana Security?
The Elastic Stack’s security measures provide appropriate access to the relevant individuals. This feature helps application, IT, Operation teams monitor well-intentioned people and keep malicious activity away, while administrators and consumers can rest assured knowing their data is kept secure and safe in the Elastic Stack.
29. Tell us about Index life management?
Index lifecycle management (ILM) allows users to design and implement a framework for deciding how long an index should survive in each of four stages, as well as the activities that should be conducted on the index throughout each phase. Because data may be placed in multiple resource tiers, this provides for greater cost control.
- Hot: Updated and queried regularly.
- Warm: the data hasn’t been updated in a while, but it’s still being queried.
- Cold/Frozen: hasn’t been updated in a long time and is rarely queried (search is possible, but slower)
- Delete: this item is no longer required.
30. Explain Filebeat?
Filebeat is a log data transporter for neighborhood documents. Introduced as an operator to your servers, Filebeat video display units the log directories or exact log records, tails the reports, and forwards them both to Elasticsearch or Logstash for indexing.
31. What segments Filebeat monitors?
For most of the files when log data is shipping then it is done through Filebeat. The segment Filebeat monitors are log directories, log files, and many more. File beat executes or forwards them to Elasticsearch or Logstash. File beat is installed on your service as an agent and it is generally all log data shippers for files available.
32. What language is Kibana written in?
- JavaScript
- TypeScript
33. How do you visualize logs in Kibana?
To create a new Kibana visualization, select Visualize in the menu on the left, click the + icon and then select the visualization you want to create. You are then presented with a choice — either create the new visualization on one of the indices you have in Elasticsearch or a saved search.
34. Can Kibana send email alerts?
Alertsedit
Kibana tracks each of these alerts separately and takes an action per alert. Using the server monitoring example, each server with average CPU > 0.9 is tracked as an alert. This means a separate email is sent for each server that exceeds the threshold.
35. What are buckets in Kibana?
Bucket aggregationsedit
In other words, the buckets effectively define document sets. In addition to the buckets themselves, the bucket aggregations also compute and return the number of documents that “fell into” each bucket. Bucket aggregations, as opposed to metrics aggregations, can hold sub-aggregations.
36. Can Kibana be used without Elasticsearch?
Kibana on the other hand, is designed to work only with Elasticsearch and thus does not support any other type of data source. In order to extrapolate data from other sources, it needs to be shipped into the ELK Stack (via Filebeat or Metricbeat, then Logstash, then Elasticsearch) in order to apply Kibana to it.
37. Is Kibana like Splunk?
Kibana is the visualization tool in the ELK Stack, and like Splunk, the platform supports the creation of visualizations such as line charts, area arts and tables and the presentation of them in a dashboard. … Still, Kibana does not support user management, but hosted ELK solutions provide it out of the box.
38. Can we save the visualizations we create in Kibana?
No, but we can take screenshots.
39. How can I see alerts in Kibana?
Head to the Alerts and Actions section inside the Kibana Management tab to see, search, and filter all of your alerts from a central location.
40. What are metrics in Kibana?
The Metrics app in Kibana enables you to visualize infrastructure metrics to help diagnose problematic spikes, identify high resource utilization, automatically discover and track pods, and unify your metrics with logs and APM data in Elasticsearch. To get started with the Metrics app, see Ingest metrics.
41. What is aggregation filter?
Filter Aggregationedit
Defines a single bucket of all the documents in the current document set context that match a specified filter. Often this will be used to narrow down the current aggregation context to a specific set of documents.
42. Which is better Kibana or Grafana?
Grafana is better suited for applications that require continuous real-time monitoring metrics like CPU load, memory, etc. Kibana is better suited for log file analysis and full-text search queries. Grafana gives custom real-time alerts as the data comes; it identifies patterns in the data and sends alerts.
43. How do I set up Kibana alert?
Alerting set upedit
In the kibana. yml configuration file, add the xpack. encryptedSavedObjects. encryptionKey setting.
For emails to have a footer with a link back to Kibana, set the server. publicBaseUrl configuration setting.
44. Is Grafana a Kibana fork?
grafana is a fork of Kibana. Kibana is a visualization tool of data in Elasticsearch, and Marvel is based on Kibana.
45. How do I create a rule in Kibana?
Kibana provides rules built into the Elastic Stack and rules registered by one of the Kibana apps. You can create most rules types in Stack Management > Rules and Connectors. For information on creating security rules, refer to Create a detection rule.
46. What is Kibana query language?
The Kibana Query Language (KQL) is a simple syntax for filtering Elasticsearch data using free text search or field-based search. KQL is only used for filtering data, and has no role in sorting or aggregating the data. KQL is able to suggest field names, values, and operators as you type.
47. What are data tables in Kibana?
The data table is type of visualization that is used to display the raw data of a composed aggregation. There are various types of aggregations that are presented by using Data tables.
48. What is Kibana lens?
Kibana Lens is an easy-to-use, intuitive UI that simplifies the process of data visualization through a drag-and-drop experience. Whether you’re exploring billions of logs or spotting trends from your website traffic, Lens gets you from data to insights in just a few clicks — no prior experience in Kibana required.
49. What is scripted fields in Kibana?
- You want to aggregate (e.g. by SUM ) on a field that it not natively an integer in ElasticSearch.
- You want to combine 2 or more fields into a single field (e.g. hostname + request path to make a full URL).
50. How do I run a painless script in Kibana?
When you go to define a scripted field in Kibana, you’ll be given a choice of scripting language, allowing you to pick from all the languages installed on the Elasticsearch nodes that have dynamic scripting enabled. By default that is “expression” and “painless” in 5.0 and just “expression” in 2.
I’m Rajesh Kumar, a DevOps, SRE, DevSecOps, Cloud, and Platform Engineering expert passionate about sharing practical knowledge, real-world experiences, and industry best practices. I have worked at Cotocus and regularly write about technology, travel, investing, health, product reviews, and digital marketing through my various platforms.
I publish technical articles at DevOps School, travel stories at Holiday Landmark, stock market insights at Stocks Mantra, health and fitness guidance at My Medic Plus, product reviews at TrueReviewNow, and SEO and digital marketing strategies at Wizbrand.
Find Trusted Cardiac Hospitals
Compare heart hospitals by city and services — all in one place.
Explore Hospitals