- What is R Language?
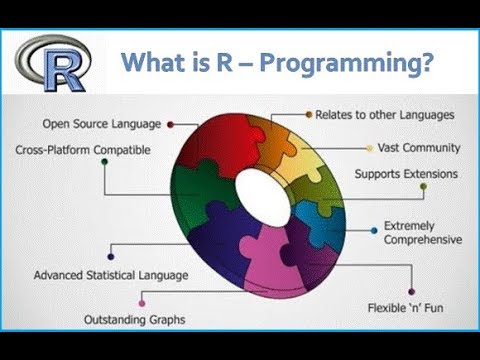
R is data analysis software which is used by analysts, quants, statisticians, data scientists and others.
2. Explain how you can start the R commander GUI?
Typing the command, (“Rcmdr”) into the R console starts the R commander GUI.
3. In R how you can import Data?
You use R commander to import Data in R, and there are three ways through which you can enter data into it
- You can enter data directly via Data New Data Set
- Import data from a plain text (ASCII) or other files (SPSS, Minitab, etc.)
- Read a data set either by typing the name of the data set or selecting the data set in the dialog box
4. List out some of the function that R provides?
The function that R provides are
- Mean
- Median
- Distribution
- Covariance
- Regression
- Non-linear
- Mixed Effects
- GLM
- GAM. etc.
5. Mention what does not ‘R’ language do?
- Though R programming can easily connects to DBMS is not a database
- R does not consist of any graphical user interface
- Though it connects to Excel/Microsoft Office easily, R language does not provide any spreadsheet view of data.
6. Explain how R commands are written?
In R, anywhere in the program you have to preface the line of code with a #sign, for example
- subtraction
- division
- note order of operations exists
7. Mention how you can produce co-relations and covariances?
You can produce co-relations by the cor () function to produce co-relations and cov () function to produce covariances.
8. How can you save your data in R?
To save data in R, there are many ways, but the easiest way of doing this is
Go to Data > Active Data Set > Export Active Data Set and a dialogue box will appear, when you click ok the dialogue box let you save your data in the usual way.
9. Explain what is t-tests in R?
In R, the t.test () function produces a variety of t-tests. T-test is the most common test in statistics and used to determine whether the means of two groups are equal to each other.
10. Explain what is With () and By () function in R is used for?
- With() function is similar to DATA in SAS, it apply an expression to a dataset.
- BY() function applies a function to each level of factors. It is similar to BY processing in SAS.
11. Explain general format of Matrices in R?
General format is
________________________________________________________________
Mymatrix< - matrix (vector, nrow=r , ncol=c , byrow=FALSE,
dimnames = list ( char_vector_ rowname, char_vector_colnames))
_________________________________________________
Code language: HTML, XML (xml)
12. What are the data structures in R that is used to perform statistical analyses and create graphs?
R has data structures like
- Vectors
- Matrices
- Arrays
- Data frames
13. Explain what is transpose?
For re-shaping data before, analysis R provides various method and transpose are the simplest method of reshaping a dataset. To transpose a matrix or a data frame t () function is used.
14. In R how missing values are represented ?
In R missing values are represented by NA (Not Available), why impossible values are represented by the symbol NaN (not a number).
15. What is the function used for adding datasets in R?
rbind function can be used to join two data frames (datasets). The two data frames must have the same variables, but they do not have to be in the same order.
16. Explain how data is aggregated in R?
By collapsing data in R by using one or more BY variables, it becomes easy. When using the aggregate() function the BY variable should be in the list.
17. What is the use of subset() function and sample() function in R ?
In R, subset() functions help you to select variables and observations while through sample() function you can choose a random sample of size n from a dataset.
18. What are the different data structures in R? Briefly explain about them.
Broadly speaking these are Data Structures available in R:
| Data Structure | Description |
| Vector | A vector is a sequence of data elements of the same basic type. Members in a vector are called components. |
| List | Lists are the R objects which contain elements of different types like − numbers, strings, vectors or another list inside it. |
| Matrix | A matrix is a two-dimensional data structure. Matrices are used to bind vectors from the same length. All the elements of a matrix must be of the same type (numeric, logical, character, complex). |
| Dataframe | A data frame is more generic than a matrix, i.e different columns can have different data types (numeric, character, logical, etc). It combines features of matrices and lists like a rectangular list. |
19. What are the different components of grammar of graphics?
Broadly speaking these are different components in grammar of graphics:
- Data layer
- Aesthetics layer
- Geometry layer
- Facet layer
- Co-ordinate layer
- Themes layer
19. How can you load a .csv file in R?
- Loading a .csv file in R is quite easy.
- All you need to do is use the “read.csv()” function and specify the path of the file.
____________________________________
house<-read.csv("C:/Users/John/Desktop/house.csv")
___________________________
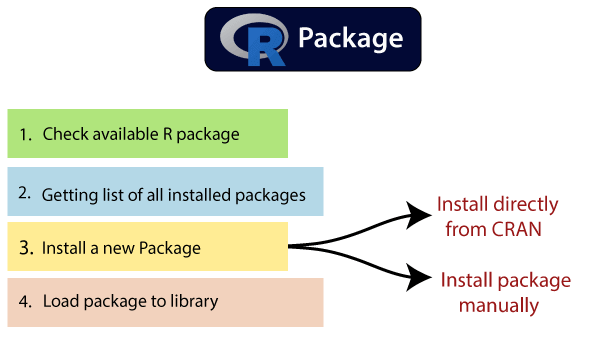
Code language: JavaScript (javascript)20. How do you install a package in R?
The below command is used to install a package in R:
____________________________________________
install.packages(“<package_name>”)
_________________________________
Code language: HTML, XML (xml)
21. Name some packages in R, which can be used for data imputation?
These are some packages in R which can used for data imputation
- MICE
- Amelia
- missForest
- Hmisc
- Mi
- imputeR
22. Tell me something about shinyR?
Shiny is an R package that makes it easy to build interactive web apps straight from R. You can host standalone apps on a webpage or embed them in Rmarkdown documents or build dashboards. You can also extend your Shiny apps with CSS themes, htmlwidgets, and JavaScript actions.
23. What packages are used for data mining in R?
Some packages used for data mining in R:
data.table– provides fast reading of large files
rpart and caret– for machine learning models.
Arules– for associaltion rule learning.
GGplot– provides varios data visualization plots.
tm– to perform text mining.
Forecast– provides functions for time series analysis
24. What do you know about the rattle package in R?
Rattle is a popular GUI for data mining using R. It presents statistical and visual summaries of data, transforms data so that it can be readily modelled, builds both unsupervised and supervised machine learning models from the data, presents the performance of models graphically, and scores new datasets for deployment into production. A key features is that all of your interactions through the graphical user interface are captured as an R script that can be readily executed in R independently of the Rattle interface.
25. Explain the data import in R language?
R provides to import data in R language. To begin with the R commander GUI, user should type the commands in the command Rcmdr into the console. Data can be imported in R language in 3 ways such as:
- Select the data set in the dialog box or enter the name of the data set as required.
- Data is entered directly using the editor of R Commander via Data->New Data Set. This works good only when the data set is not too large.
- Data can also be imported from a URL or from plain text file (ASCII), or from any statistical package or from the clipboard.
26. Explain how to communicate the outputs of data analysis using R language?
Combine the data, code and analysis results in a single document using knitr for Reproducible research done. Helps to verify the findings, add to them and engage in conversations. Reproducible research makes it easy to redo the experiments by inserting new data values and applying it to different various problems.
27. Difference between library () and require () functions in R language?
| Library() | Require() |
| Library () function gives an error message display, if the desired package cannot be loaded. | Require () function is used inside function and throws a warning messages whenever a particular package is not Found |
| It loads the packages whether it is already loaded or not, | It just checks that it is loaded, or loads it if it isn’t (use in functions that rely on a certain package). The documentation explicitly states that neither function will reload an already loaded package. |
Consider a related program for the above differentiation.
___________________________________________
<!-- wp:paragraph -->
<p>if(!require(package, character.only=T, quietly=T)) {</p>
<!-- /wp:paragraph -->

<!-- wp:paragraph -->
<p>install.packages (package)</p>
<!-- /wp:paragraph -->

<!-- wp:paragraph -->
<p>library(package, character.only=T)</p>
<!-- /wp:paragraph -->

<!-- wp:paragraph -->
<p>}</p>
<!-- /wp:paragraph -->
___________________________________
Code language: HTML, XML (xml)
For multiple packages you can use
_____________________________________________
for(package in c('', '')) {

if(!require(package, character.only=T, quietly=T)) {

install.packages (package)

library(package, character.only=T)

}

}
___________________________________
Code language: JavaScript (javascript)
28. What are the disadvantages of R Programming?
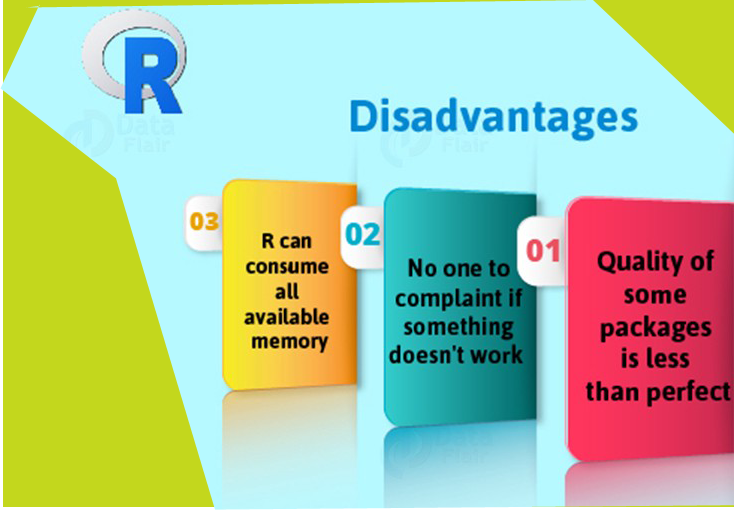
The disadvantages are:-
- Lack of standard GUI
- Not good for big data.
- Does not provide spreadsheet view of data.
29. What is the use of With () and By () function in R?
with() function applies an expression to a dataset.
___________________________________
#with(data,expression)
__________________________
Code language: CSS (css)
By() function applies a function t each level of a factors.
_________________________________
#by(data,factorlist,function)
_________________________
Code language: CSS (css)
30. In R programming, how missing values are represented?
In R missing values are represented by NA which should be in capital letters.
31. Explain what is transpose?
Transpose is used for reshaping of the data which is used for analysis. Transpose is performed by t() function.
32. What are the advantages of R?
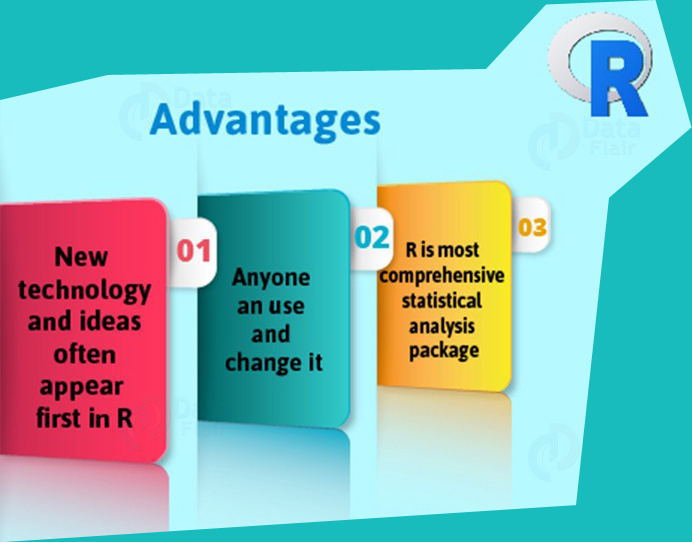
The advantages are:-
- It is used for managing and manipulating of data.
- No license restrictions
- Free and open source software.
- Graphical capabilities of R are good.
- Runs on many Operating system and different hardware and also run on 32 & 64 bit processors etc.
33. How you can produce co-relations and covariances?
Cor-relations is produced by cor() and covariances is produced by cov() function.
34. What is difference between matrix and dataframes?
Dataframe can contain different type of data but matrix can contain only similar type of data. Here are the different types of data structures in R:
35. What is difference between lapply and sapply?
lapply is used to show the output in the form of list whereas sapply is used to show the output in the form of vector or data frame.
36. What is the difference between seq(4) and seq_along(4)?
Seq(4) means vector from 1 to 4 (c(1,2,3,4)) whereas seq_along(4) means a vector of the length(4) or 1(c(1)).
37. Explain how you can start the R commander GUI?
rcmdr command is used to start the R commander GUI.
38. What is the memory limit of R?
In 32 bit system memory limit is 3Gb but most versions limited to 2Gb and in 64 bit system memory limit is 8Tb.
39. How many data structures R has?
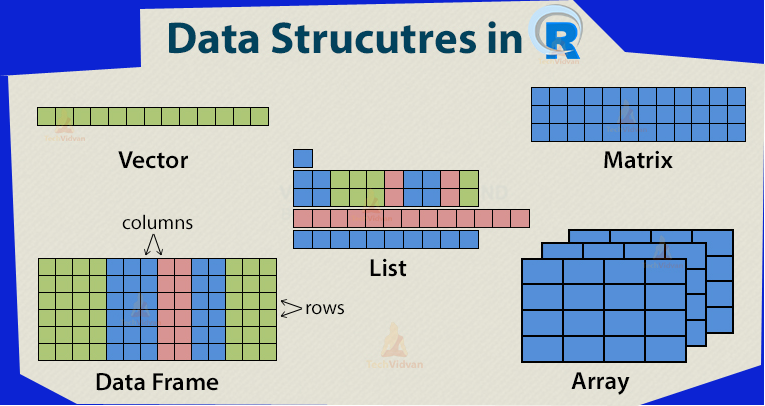
There are 5 data structures in R i.e. vector, matrix, array which are of a homogenous type and the other two are list and data frame which are heterogeneous.
40. How many sorting algorithms are available?
There are 5 types of sorting algorithms are used which are:-
- Bubble Sort
- Selection Sort
- Merge Sort
- Quick Sort
- Bucket Sort
41. How to create new variable in R programming?
____________________________________
For creating new variable assignment operator ‘<-’ is used
For e.g. mydata$sum <- mydata$x1 + mydata$x2
____________________________
Code language: PHP (php)
42. What are R packages?
Packages are the collections of data, R functions and compiled code in a well-defined format and these packages are stored in library. One of the strengths of R is the user-written function in R language.
43. What is the workspace in R?
Workspace is the current R working environment which includes any user defined objects like vector, lists etc.
44. What is the function which is used for merging of data frames horizontally in R?
Merge()function is used to merge two data framesa
________________________________________________
Eg. Sum<-merge(data frame1,data frame 2,by=’ID’)
______________________________________
Code language: HTML, XML (xml)
45. what is the function which is used for merging of data frames vertically in R?
rbind() function is used to merge two data frames vertically.
____________________________________
Eg. Sum <- rbind(data frame1,data frame 2)
____________________________
46. Which method is used for exporting the data in R?
There are many ways to export the data into another formats like SPSS, SAS , Stata , Excel Spreadsheet.
47. What is the use of tapply?
IOS-6.1.3
48. Explain app specific objects which store the app contents?
The app specific objects are Data model objects that store app’s contents.
49. What is GGobi?
GGobi is an open-source program for data visualization for exploring high dimensional typed data.
50. How to create scatterplot matrices?
Pair() or splom() function is used for create scatterplot matrices.
I’m Rajesh Kumar, a DevOps, SRE, DevSecOps, Cloud, and Platform Engineering expert passionate about sharing practical knowledge, real-world experiences, and industry best practices. I have worked at Cotocus and regularly write about technology, travel, investing, health, product reviews, and digital marketing through my various platforms.
I publish technical articles at DevOps School, travel stories at Holiday Landmark, stock market insights at Stocks Mantra, health and fitness guidance at My Medic Plus, product reviews at TrueReviewNow, and SEO and digital marketing strategies at Wizbrand.
Find Trusted Cardiac Hospitals
Compare heart hospitals by city and services — all in one place.
Explore Hospitals