History & Origin of Zabbix
Zabbix was created by Alexei Vladyshev and is currently actively developed and supported by Zabbix SIA. Zabbix is an enterprise-class open source distributed monitoring solution. Zabbix is software that monitors the health and integrity of multiple parameters of a network and servers. Zabbix utilizes a flexible notification mechanism that allows users to configure e-mail based alerts for virtually any event. This allows for quick response to server problems. Zabbix provides excellent reporting and data visualization features based on archived data. This makes Zabbix perfect for capacity planning.
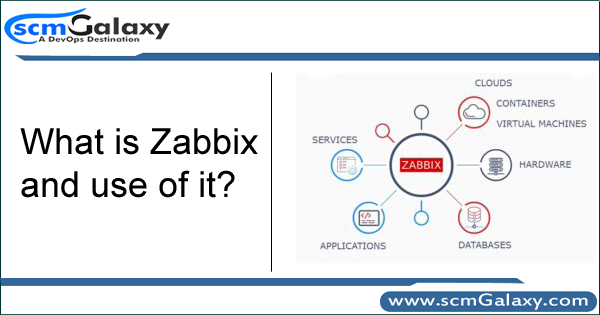
What is Zabbix?
Zabbix is defined as an open-source monitoring tool that is used to monitor servers, networks, IT components, cloud services, and virtual machines. The Zabbix monitoring tool is used to provide monitoring metrics and monitor network usage, disk space consumption, and CPU load. The tool supports various operating systems like Mac OS, Solaris, Linux, and many more. The tool uses a separate database to store the data and monitor the applications. Zabbix Monitoring Tool is developed in C programming language, and PHP language is used for web frontend.
Features of Zabbix are:
- Visualization
- Zabbix API
- Notification and remediation
- Effortless deployments
- Security and authentication
- Metric collection
- Problem detection
- Distributed monitoring
Why use Zabbix?
- Open Source solution
- Very easy setup
- Very simple configuration
- High-level service tree
- Built-in housekeeping procedure
- Highly efficient agents for UNIX and WIN32 based platforms
- Low learning curve
- High ROI. Downtimes are very expensive.
- Low cost of ownership
- Centralized monitoring system. All information (configuration, performance data) is stored in a relational database
- Support for SNMP (v1,v2). Both trapping and polling.
- Visualization capabilities
Advantages of Zabbix
- Nice web interface.
- Monitor both server and network devices.
- Flexibility in decentralizing users.
- Easy to manipulate and configure: All Zabbix configuration is through web interface. …
- Supports Linux, Solaris, FreeBSD …
- Trusted in user authentication.
- Report problems via email and SMS.
Disadvantages of an Zabbix
- Zabbix must include the Amazon RDS.
- UI/UX needs to be more catchy and detailed.
- Zabbix must provide more templates for rich monitoring.
Best Zabbix Alternative
- Datadog.
- AppDynamics.
- Dynatrace
- LogicMonitor.
- PRTG Network Monitor.
- checkmk.
- Microsoft System Center.
Best Resources to Learn Zabbix
Free Video Tutorials Zabbix
Zabbix Interview Questions and Answers
1) What can be monitored using Zabbix?
Zabbix provides monitoring metrics, such as network utilization, CPU load, and disk space consumption. The software monitors operations on Linux, Hewlett Packard Unix (HP-UX), Mac OS X, Solaris, and other operating systems (OSes); however, Windows monitoring is only possible through agents.
2) Is Prometheus better than Zabbix?
Prometheus is faster because of the database and Zabbix has a smaller footprint (because it’s written in C). In Zabbix, you can do most things in the web GUI, but in Prometheus, you must edit files like in Nagios.
3) Which is better Nagios vs Zabbix?
After comparing the two it is clear that Zabbix is the winner. While Nagios Core has the basics in place to run effective network monitoring it simply doesn’t have the experience and configurability that Zabbix does. Zabbix is a free network monitor that performs like a product situated in the very top price bracket.
4) Does Zabbix support Netflow?
Netflow / Slow monitoring and integration with Zabbix.
5) Is Zabbix a DevOps tool?
Both Nagios & Zabbix are ‘traditional’ tools – widely used, downloadable and open source. But these tools aren’t well-equipped to handle DevOps’ rapidly changing environment.
6) How do I monitor Kubernetes with Zabbix?
Installation
Copy k8s-stats.py to /etc/zabbix/scripts/ and k8s.conf to /etc/zabbix/zabbix_agentd.d/
Import Zabbix template (k8s-Zabbix-template.xml) to Zabbix server.
Create Zabbix user in Kubernetes (can use Zabbix-user-example. yml) and set its token and API server URL in k8s-stats.py.
Apply a template to host.
7) Is Zabbix easy?
It has an intuitive UI with beautiful graphs and customizable maps. The flexibility of this solution is amazing. It’s a very reliable platform and we’ve never had any issues regarding the scalability or the stability of Zabbix. … We have found that Zabbix is easier to use than other applications.
8) What are the features of Zabbix?
The main features of Zabbix are:
Visualization.
Effortless deployments.
Metric collection.
Notification and remediation.
Problem detection.
Distributed monitoring.
Zabbix API.
Security and authentication.
9) Is Zabbix any good?
The Best Security Monitoring Application
“I would say that Zabbix is an open-source monitoring software tool for various IT components, including networks, servers, virtual machines, and cloud services. That it is a tool of great quality and with great security.”
10) Does Zabbix use Java?
Zabbix is software that monitors numerous parameters of a network and the health and integrity of servers. … Zabbix Java gateway is a daemon written in Java.
11) Can Zabbix run on Windows?
Let’s try to install a Zabbix agent on a server running Windows and add it to our Zabbix monitoring server. You can download a Zabbix agent version for Windows here: https://www.zabbix.com/download_agents.
12) Is Zabbix an RMM?
Compare SolarWinds RMM vs Zabbix
SolarWinds RMM is a remote management software, which assists in monitoring network operational tasks through the use of probes and monitors. … Zabbix is a network monitoring software that allows real-time network performance monitoring and management.
13) How does Zabbix proxy work?
Zabbix proxy is a process that may collect monitoring data from one or more monitored devices and send the information to the Zabbix server, essentially working on behalf of the server. All collected data is buffered locally and then transferred to the Zabbix server the proxy belongs to.
14) How much does Zabbix cost?
Zabbix pricing starts at $1600.00 per year. There is a free version. Zabbix offers a free trial.
15) How does Zabbix integrate with Prometheus?
In the latest release of Zabbix, Prometheus integration is available out of the box. It allows us to easily collect and parse metrics from collectors.
…
Creating an HTTP master item
Go to Configuration > Hosts > Items.
Click on Create item.
Enter item parameters in the form.
16) Is Zabbix a continuous monitoring tool?
One of the major differences between the two tools is that the Nagios tool is a continuous monitoring tool, whereas the Zabbix tool is not.
17) Is Zabbix a SaaS?
What are the billing model and rates of the Zabbix Cloud platform? The billing model is a SaaS.
18) Is Zabbix a fork of Nagios?
Zabbix comes along in 2001. It’s a full-blown development, not a simple Nagios fork, and its main characteristic is that it has a very holistic view of monitoring. It covers performance, not only statuses, which is one of the most significant lacks in Nagios.
19) Which software is used for networking?
Web Browser: A web browser is a network application that enables users to access the internet. Web browser interprets HTML (HyperText Mark-up Language) files sent from a Web Server and displays the content on its screen. Web Browser is the most widely used network application.
20) Who created Zabbix?
Alexei Vladishev
The Zabbix company was established in 2005 when its CEO and owner, Alexei Vladishev, made a game-changing decision to develop further the monitoring solution he worked on
I’m Rajesh Kumar, a DevOps, SRE, DevSecOps, Cloud, and Platform Engineering expert passionate about sharing practical knowledge, real-world experiences, and industry best practices. I have worked at Cotocus and regularly write about technology, travel, investing, health, product reviews, and digital marketing through my various platforms.
I publish technical articles at DevOps School, travel stories at Holiday Landmark, stock market insights at Stocks Mantra, health and fitness guidance at My Medic Plus, product reviews at TrueReviewNow, and SEO and digital marketing strategies at Wizbrand.
Find Trusted Cardiac Hospitals
Compare heart hospitals by city and services — all in one place.
Explore Hospitals