
As a data analyst, one of the most important tasks is to present your findings in a clear and concise manner. Data visualization tools are essential for this purpose. With so many options available in the market, it can be overwhelming to choose the right one for your needs. In this article, we will be discussing some of the best data visualization tools that can help you create stunning visualizations.
Tableau
Tableau is a popular data visualization tool that enables users to create interactive dashboards and visualizations. It offers a wide range of features such as drag-and-drop functionality, real-time data collaboration, and customizable dashboards. Tableau can handle data from multiple sources such as spreadsheets, databases, and cloud services. It also offers a range of visualization types such as bar charts, line charts, scatter plots, and maps.
Power BI
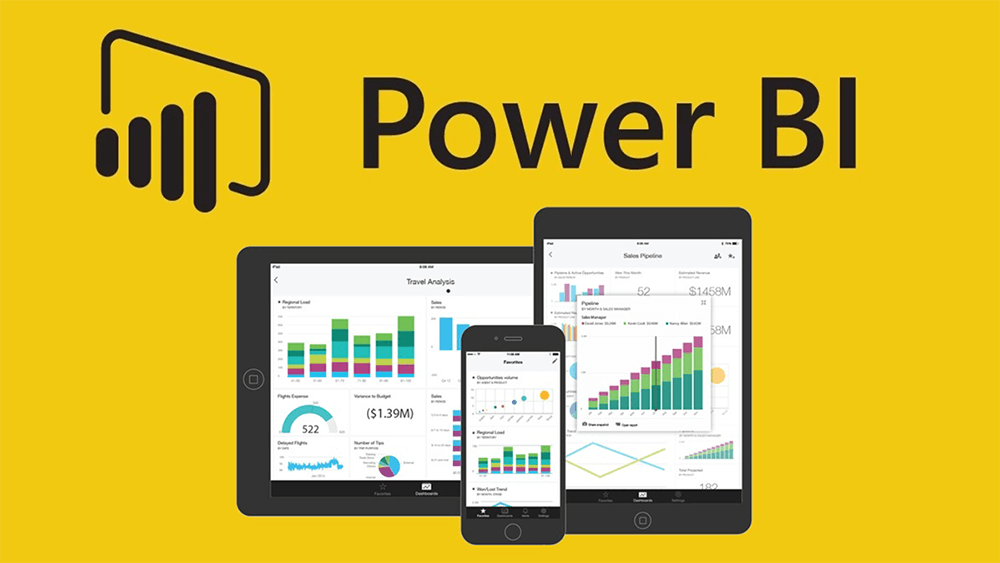
Power BI is another popular data visualization tool that is widely used by businesses of all sizes. It offers a range of features such as data modeling, data preparation, and visualization. Power BI offers a range of visualization types such as tables, charts, and maps. It also allows users to create custom visuals using its developer tools.
QlikView
QlikView is a business intelligence and data analytics tool that offers a range of features such as data discovery, data visualization, and data reporting. It can handle large amounts of data and offers a range of visualization types such as bar charts, line charts, and scatter plots. QlikView also offers a range of interactive features such as drill-down and drill-through capabilities.
D3.js

D3.js is a powerful data visualization library that is widely used by web developers. It allows users to create custom visualizations using JavaScript and HTML. D3.js offers a range of visualization types such as bar charts, line charts, and scatter plots. It is highly customizable and allows users to create interactive visualizations using its selection and transition features.
Google Charts
Google Charts is a data visualization tool that is widely used by businesses of all sizes. It offers a range of features such as real-time data collaboration, customizable charts, and interactive dashboards. Google Charts can handle data from multiple sources such as spreadsheets, databases, and cloud services. It also offers a range of visualization types such as bar charts, line charts, and scatter plots.
Plotly

Plotly is a data visualization tool that is widely used by data scientists and analysts. It offers a range of features such as interactive dashboards, data sharing, and customizable charts. Plotly can handle data from multiple sources such as spreadsheets, databases, and cloud services. It also offers a range of visualization types such as bar charts, line charts, and scatter plots.
Conclusion
In conclusion, there are many data visualization tools available in the market that can help you create stunning visualizations. Tableau, Power BI, QlikView, D3.js, Google Charts, and Plotly are some of the best data visualization tools that are widely used by businesses of all sizes. Each tool offers a unique set of features and visualization types, so it is important to choose the one that best suits your needs.

👤 About the Author
Ashwani is passionate about DevOps, DevSecOps, SRE, MLOps, and AiOps, with a strong drive to simplify and scale modern IT operations. Through continuous learning and sharing, Ashwani helps organizations and engineers adopt best practices for automation, security, reliability, and AI-driven operations.
🌐 Connect & Follow:
- Website: WizBrand.com
- Facebook: facebook.com/DevOpsSchool
- X (Twitter): x.com/DevOpsSchools
- LinkedIn: linkedin.com/company/devopsschool
- YouTube: youtube.com/@TheDevOpsSchool
- Instagram: instagram.com/devopsschool
- Quora: devopsschool.quora.com
- Email– contact@devopsschool.com
Find Trusted Cardiac Hospitals
Compare heart hospitals by city and services — all in one place.
Explore Hospitals