
Introduction
Modern software delivery demands both speed and stability, yet many organizations struggle with long release cycles despite heavy investments in automated pipelines and cloud infrastructure. Value Stream Mapping (VSM) solves this visibility challenge by providing a practical methodology to trace work from initial idea through development, testing, security, and production. By capturing this complete journey, engineering teams can expose long waiting periods, handoff friction, and manual delays, establishing a data-driven baseline to transition from reactive firefighting to structured, continuous operational improvement with guidance from platforms like DevOpsSchool.
What Is Value Stream Mapping?
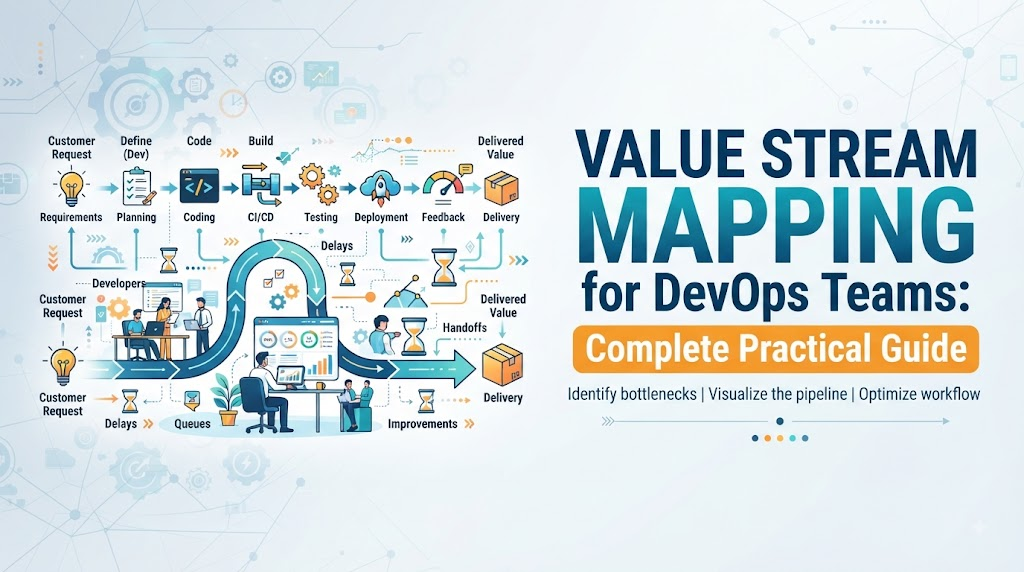
Adapted from Lean manufacturing, Value Stream Mapping in DevOps is an analytical practice used to visualize and optimize the end-to-end flow of information and artifacts required to deliver software to end users. It tracks a work item across each process stage to measure overall flow against operational waste, explicit handoffs, and key temporal metrics—specifically distinguishing active processing time from idle waiting time and total lead time. Unlike a simple process flowchart that merely sketches ideal steps and conditional logic, a value stream map captures real-world empirical performance data to reveal exact points of system friction and delay.
To measure a value stream effectively, teams track specific temporal elements:
- Lead time: The total time elapsed from the initial request creation to production delivery.
- Processing time: The active time spent actually working on the item.
- Waiting time: The idle time spent waiting in queues, approval chains, or handoffs between stages.
It is critical to distinguish a value stream map from a simple process flowchart. A standard flowchart highlights nominal, ideal steps and conditional logic without tracking temporal metrics. In contrast, a value stream map captures empirical performance data, operational delays, handoffs, queue volumes, rework percentages, and explicit distinctions between active execution time and idle time.
Process Flowchart:
[ Idea ] ---> [ Code ] ---> [ Test ] ---> [ Deploy ]

Value Stream Map:
[ Idea ] -> (Wait: 5d) -> [ Code ] -> (Wait: 2d) -> [ Test ] -> (Wait: 3d) -> [ Deploy ]
           | Active: 2d |           | Active: 1d |           | Active: 1h |
Code language: JavaScript (javascript)
Why Value Stream Mapping Matters for DevOps
Value Stream Mapping establishes objective visibility across software delivery pipelines, removing subjective guesswork so teams can target the exact bottlenecks that limit overall throughput. Because active development often accounts for only a fraction of total lead time, identifying and reducing idle waiting periods between handoffs offers the fastest path to accelerated delivery without overburdening developers. By fostering cross-functional collaboration and exposing repetitive manual dependencies—such as environment provisioning or compliance sign-offs—VSM provides a clear roadmap for high-value automation and continuous systemic improvement.
Value Stream Mapping in DevOps
The stages within a DevOps value stream map vary across organizations based on regulatory demands, architecture, team structures, and deployment infrastructure. A typical software delivery value stream spans multiple operational stages, each prone to specific structural bottlenecks.
| DevOps Stage | Typical Activity | Possible Bottleneck |
| Idea | Capturing customer needs and feature requests | Unclear requirements, scope creep |
| Planning | Refining stories, capacity allocation, backlog prioritization | Slow prioritization, context switching |
| Development | Writing code, local testing, committing changes | Environment setup friction, technical debt |
| Code Review | Peer review, pull request analysis, static code checks | Context switching, reviewer unavailability |
| Build | Compilation, dependency resolution, artifact generation | Slow build scripts, dependency lockouts |
| Testing | Functional, integration, and regression testing | Flaky test suites, manual QA execution |
| Security | Vulnerability scanning, compliance checks, SAST/DAST | Late security reviews, false positives |
| Deployment Approval | Change advisory board (CAB) review, sign-offs | Infrequent approval meetings, manual checks |
| Production Deployment | Artifact release, infrastructure configuration, database migration | Complex deployment scripts, maintenance windows |
| Feedback | Log monitoring, user metrics gathering, incident analysis | Unclear telemetry, missing feedback loops |
Process stages and associated metrics are never uniform across all companies. Highly regulated enterprise environments may feature mandatory manual compliance steps, while web-scale SaaS organizations leverage automated continuous deployment. Teams must tailor their value stream maps to mirror their specific operational reality rather than forcing an idealized, rigid template onto their organization.
Value-Added vs Non-Value-Added Work
To systematically eliminate inefficiency, DevOps teams must classify every step within their software delivery pipeline into one of three distinct categories of work.
+-----------------------------------------------------------------------+
|                         Total Work Pipeline                           |
+-----------------------------------+-----------------------------------+
|          Value-Added Work         |      Non-Value-Added Work        |
|  (Feature Dev, Automated Builds)  |   (Waiting, Rework, Manual QA)    |
+-----------------------------------+-----------------------------------+
|               Necessary Non-Value-Added Work                          |
|         (Security Audits, Compliance Scans, Regulatory Reporting)     |
+-----------------------------------------------------------------------+
Value-Added Work
Value-Added (VA) work consists of activities that directly transform software assets to meet customer requirements. The end user recognizes the value of this work and is functionally paying for its completion.
- Examples: Writing business logic features, designing application UI, resolving functional bugs, and configuring core service functionality.
Non-Value-Added Work
Non-Value-Added (NVA) work consumes time, human effort, or system resources without contributing functional value to the customer. This work represents pure waste and should be systematically targeted for removal.
- Examples: Waiting for manual release approvals, waiting for staging server availability, manually re-testing features due to flaky environments, context-switching between unprioritized tasks, and resolving code integration conflicts caused by long-lived feature branches.
Necessary Non-Value-Added Work
Necessary Non-Value-Added (NNVA) work does not directly contribute feature value to the end user, but is strictly required to satisfy business operations, legal compliance, risk management, or regulatory mandates.
- Examples: Executing automated security scans, conducting architectural review boards for critical financial compliance, executing vulnerability scans, generating audit logs, and maintaining compliance documentation.
The primary operational goal in DevOps Value Stream Mapping is to completely eliminate Non-Value-Added work while optimizing and streamlining Necessary Non-Value-Added work through automated governance and continuous security integration.
Lead Time vs Cycle Time vs Processing Time
Accurate measurement requires clear definition of core delivery metrics. Confusing active working time with total calendar duration leads to inaccurate baseline measurements and ineffective optimization strategies.
|=================================== LEAD TIME ===================================|
|-------------- CYCLE TIME --------------|
                [ Development ]  (Wait)  [ Testing ]  (Wait)  [ Deployment ]
                |-- Processing--|        |--Proc.--|          |-- Processing|
- Lead Time: The total time measured from the moment a work item is requested or created in a backlog until it is fully deployed into production, delivering value to the customer.
- Cycle Time: The subset of lead time measured from when active work begins on a task (e.g., a developer starts working on a ticket) until the feature is ready or released into production.
- Processing Time: The total active time spent executing work on the item across all stages, excluding any idle periods.
- Waiting Time: The accumulative time a work item sits idle in queues, pending reviews, environments, or approvals between processing steps.
| Metric | Meaning | DevOps Example |
| Lead Time | Total duration from customer request to production release | User story created on Jan 1st, released on Jan 30th (30 days total) |
| Cycle Time | Duration from development start to production release | Developer picks up ticket on Jan 10th, released on Jan 30th (20 days total) |
| Processing Time | Actual hands-on effort spent actively executing work | 8 hours writing code + 2 hours code review + 1 hour build/deploy (11 hours total) |
| Waiting Time | Total duration work sits idle in queues or handoffs | 5 days waiting for review + 10 days waiting for QA environment access (15 days total) |
Teams must not confuse active work time with overall delivery duration. An item requiring only 5 hours of processing time can easily experience a lead time of 3 weeks if it spends most of its lifecycle waiting in queues.
How to Create a Value Stream Map for a DevOps Team
Creating an accurate value stream map requires an empirical approach based on observed workflow data rather than idealized expectations.
Step 1: Define the Value Stream
Clearly outline the boundaries of the analysis. Determine the precise starting point (e.g., feature request logging in Jira) and the end point (e.g., successful deployment to production with user activity).
Step 2: Select a Work Item
Focus on a representative, standard unit of work, such as a medium-priority user story or a routine bug fix. Avoid picking atypical emergency hotfixes or massive architecture overhaul tasks for your baseline map.
Step 3: Identify Process Stages
Document every operational phase the work item must pass through. Include every distinct functional stage, such as planning, coding, pull request review, build processing, integration testing, security scanning, change management review, and release execution.
Step 4: Identify Handoffs
Map every transition where responsibility shifts between individuals, teams, or platform systems. Handoff points between functional silos are prime locations for communication breakdowns, lost context, and severe queueing delays.
Step 5: Measure Waiting Time
Gather empirical data on how long work items sit idle between each process stage. Measure queue times before code reviews, delay times for QA environment provisioning, and waiting periods for manual CAB sign-offs.
Step 6: Measure Processing Time
Record the actual hands-on execution duration for each stage. Calculate the true active time spent writing code, reviewing pull requests, running test scripts, executing builds, and deploying artifacts.
Step 7: Identify Bottlenecks
Analyze accumulated metrics to locate stages with disproportionately long queues, high waiting times, or high work-in-progress (WIP) volume. The stage that limits total system output is your primary bottleneck.
Step 8: Identify Waste
Identify instances of non-value-added effort across the pipeline. Track rework loops (e.g., code failing QA and returning to development), redundant manual test runs, duplicate status reporting, and context-switching overhead.
Step 9: Prioritize Improvements
Focus improvement initiatives on bottlenecks that deliver the greatest reduction in overall lead time. Address systemic constraints before spending effort on minor localized optimizations.
Step 10: Create a Future-State Map
Design an optimized future-state value stream map that eliminates identified waste, automates manual approvals, and streamlines handoffs. Use this future-state vision as a hypothesis-driven target for continuous improvement.
Example DevOps Value Stream Map
The following text-based diagram outlines a typical current-state delivery stream for an enterprise software engineering team, showing active processing times alongside idle waiting times.
[ Business Requirement ]
      ↓
  (Wait: 5 Days)
      ↓
[ Product Planning ] -------> (Processing Time: 4 Hours)
      ↓
  (Wait: 3 Days)
      ↓
[ Development ] ------------> (Processing Time: 16 Hours)
      ↓
  (Wait: 2 Days - Queue for Review)
      ↓
[ Code Review ] ------------> (Processing Time: 2 Hours)
      ↓
  (Wait: 1 Day - CI Pipeline Queue)
      ↓
[ Build & Unit Test ] ------> (Processing Time: 0.5 Hours)
      ↓
  (Wait: 4 Days - Environment Scheduling)
      ↓
[ Automated Testing ] ------> (Processing Time: 3 Hours)
      ↓
  (Wait: 6 Days - External Audit Queue)
      ↓
[ Security Validation ] ----> (Processing Time: 4 Hours)
      ↓
  (Wait: 5 Days - Weekly CAB Meeting)
      ↓
[ Deployment Approval ] ----> (Processing Time: 1 Hour)
      ↓
  (Wait: 2 Days - Staging Queue)
      ↓
[ Production Deployment ] --> (Processing Time: 2 Hours)
      ↓
[ Monitoring & Feedback ] --> (Continuous Processing)
Code language: CSS (css)
In this baseline example, total active processing time equals 32.5 hours (roughly 4 business days). However, total accumulated waiting time equals 28 days. The data shows that the work item spends nearly 88% of its overall lifecycle sitting completely idle in handoff queues, approval delays, and environment dependencies.
Real-World Value Stream Mapping Example
Scenario
A mid-sized SaaS engineering team struggled with sluggish software releases. Product managers expressed frustration that minor features routinely took six weeks to reach users. Software developers maintained that they completed coding quickly and blamed downstream infrastructure and security teams for release delays.
Current Process
The team’s workflow consisted of sprint planning, feature coding, peer reviews on GitHub, manual build deployment to a shared staging server, manual regression testing by a centralized QA team, manual vulnerability scanning by security, and weekly manual release execution by operations engineers.
Data Collection
The engineering manager gathered historical data across 30 recent feature tickets to establish reliable averages for processing and waiting times:
- Development (Coding): Processing Time = 12 hours | Waiting Time = 1 day
- Code Review: Processing Time = 2 hours | Waiting Time = 3 days
- Staging Deployment & QA: Processing Time = 8 hours | Waiting Time = 7 days
- Security Scanning: Processing Time = 3 hours | Waiting Time = 8 days
- CAB & Release: Processing Time = 2 hours | Waiting Time = 6 days
Metrics Summary:
Total Processing Time = 25 Hours (~3 Business Days)
Total Waiting Time    = 25 Days
Total Lead Time       = ~28 Days
Bottlenecks Identified
- Code Review Delays: Pull requests sat idle while reviewers context-switched between competing tasks.
- Environment Bottlenecks: Developers constantly waited for a single, shared staging environment to become available for QA.
- Manual Security Scans: The security team received code batches late in the delivery cycle, creating extensive audit backlogs.
- Manual Release Approvals: Releases were restricted to rigid weekly deployment windows requiring manual change sign-offs.
Improvement Plan
- Implement PR auto-assignments and enforce maximum pull request sizes to speed up code reviews.
- Migrate from a shared staging server to automated, containerized ephemeral preview environments provisioned dynamically via Infrastructure as Code (IaC).
- Shift security left by embedding automated static application security testing (SAST) and container scanning directly into the CI build pipeline.
- Replace manual Change Advisory Board sign-offs for low-risk changes with automated CI/CD pipeline pass gates.
Future-State Process
- Development & Automated Review: Processing Time = 10 hours | Waiting Time = 4 hours
- Automated CI Build & SAST: Processing Time = 0.5 hours | Waiting Time = 0 hours
- Ephemeral QA Testing: Processing Time = 2 hours | Waiting Time = 2 hours
- Automated Production Deployment: Processing Time = 0.5 hours | Waiting Time = 1 hour
Improved Metrics Summary:
Total Processing Time = 13 Hours
Total Waiting Time    = 7 Hours
Total Lead Time       = 20 Hours (< 1 Calendar Day)
Lessons Learned
Measuring the total delivery stream revealed that optimizing developer typing speed would have yielded negligible results. Real acceleration was achieved by eliminating idle handoff queues, building ephemeral environments, and embedding automated security gates into the pipeline.
Common Bottlenecks in DevOps Value Streams
Engineering teams frequently encounter predictable operational bottlenecks across the software delivery lifecycle.
Manual Approvals
Change Advisory Boards (CAB) and manual sign-offs introduce long waiting times.
- Improvement: Replace manual sign-offs with automated compliance verification pipelines and policy-as-code frameworks.
Slow Code Reviews
Pull requests sit untouched for days because team members prioritize active task execution over peer reviews.
- Improvement: Set limits on pull request size, automate review notifications, and enforce team SLAs for code reviews.
Long Build Times
Compilation, artifact building, and dependency downloads take hours, delaying developer feedback.
- Improvement: Implement dependency caching, parallel build steps, dynamic build agents, and modular build architectures.
Flaky Tests
Unreliable automated test suites produce false failures, forcing manual re-execution and building distrust in pipeline execution.
- Improvement: Quarantine unstable tests, optimize test suites, isolate test data, and fix root cause instabilities.
Limited Test Environments
Multiple feature teams fight over access to a single shared staging environment.
- Improvement: Adopt Infrastructure as Code (IaC) to dynamically provision isolated preview environments on demand.
Manual Security Checks
Security reviews conducted at the end of development delay releases and force extensive late-stage rework.
- Improvement: Integrate security scanning tools directly into developer IDEs and early CI pipeline execution.
Infrastructure Provisioning Delays
Operations teams require days or weeks to allocate databases, storage buckets, or cloud instances manually.
- Improvement: Enable developer self-service through automated Platform Engineering portals backed by IaC modules.
Deployment Windows
Releases are restricted to late-night off-peak hours or bi-weekly maintenance windows.
- Improvement: Implement feature flags, blue-green deployments, and canary releases to safely deploy during business hours.
Poor Documentation
Missing environment configuration specifications or deployment runbooks result in frequent release failures and troubleshooting delays.
- Improvement: Maintain operational runbooks as code alongside application repositories in Git.
Team Dependencies
Teams wait on specialized external groups (e.g., DBA teams, network engineers) to perform routine operational tasks.
- Improvement: Empower cross-functional stream-aligned teams with automated platform capabilities.
Lack of Automation
Manual deployment actions, static regression testing, and configuration adjustments introduce human error and process friction.
- Improvement: Systematically automate repeatable operational processes using robust CI/CD frameworks.
Waste in DevOps Value Streams
In software delivery, waste consists of any activity or delay that consumes engineering resources without delivering value to the customer.
| Waste Type | DevOps Example | Possible Improvement |
| Waiting | Developers waiting for build completion, testing, or environment access | Implement parallel builds and dynamic cloud environment provisioning |
| Rework | Fixing code bugs caught late in staging or production environments | Shift quality checks left via pre-commit hooks and local unit testing |
| Handoffs | Manual context transfer between Development, QA, Security, and Operations | Create cross-functional, stream-aligned teams with shared responsibilities |
| Overprocessing | Excessively detailed documentation or duplicate manual status reporting | Automate compliance tracking and deployment logging through pipeline tools |
| Unused Work | Features coded but left unreleased for months due to blocked pipelines | Reduce Work-in-Progress (WIP) limits and commit to smaller release batches |
| Context Switching | Engineers jumping between bug fixes, feature tasks, and operational alarms | Implement focused, uninterrupted work blocks and optimize operational rotation |
| Manual Repetition | Manually executing test scripts or configuring servers for every release | Automate regression testing suites and configuration management scripts |
| Defects | Production outages caused by unvalidated infrastructure or code changes | Introduce automated regression testing, canary deployments, and rollbacks |
| Unnecessary Approvals | Multi-tier sign-offs for minor, low-risk documentation or bug fixes | Define automated risk-based routing for code deployments |
Metrics to Collect During Value Stream Mapping
Collecting precise operational data prevents subjective opinions from skewing pipeline improvements. Focus tracking on core operational metrics that point to targeted interventions.
                  +-----------------------------------+
                  |   Value Stream Measurement Map    |
                  +-----------------------------------+
                                    |
         +--------------------------+--------------------------+
         |                                                     |
  [ Flow Duration ]                                     [ Quality & Throughput ]
  - Lead Time                                           - Deployment Frequency
  - Cycle Time                                          - Change Failure Rate
  - Processing Time                                     - Rework Percentage
  - Waiting Time                                        - Queue Volume
Code language: JavaScript (javascript)- Lead Time: Total time elapsed from initial feature request to production availability.
- Cycle Time: Duration measured from active development kickoff to production deployment.
- Processing Time: Active time spent performing work across all stages.
- Waiting Time: Total idle time spent in queues, reviews, and sign-offs.
- Deployment Frequency: How often code is successfully deployed to production.
- Change Failure Rate: Percentage of production deployments causing degradations that require rollbacks or hotfixes.
- Rework Percentage: Percentage of work items returned to upstream stages due to defects or failed reviews.
- Queue Time: Time work items wait in an unassigned or unprocessed state before execution starts.
- Review Time: Duration required to complete peer code reviews and merge pull requests.
- Testing Time: Total time spent running automated and manual test suites.
- Deployment Time: Clock time required to execute automated release scripts into target environments.
Focus on metrics that address specific operational bottlenecks rather than gathering vast amounts of unused data.
Value Stream Mapping and CI/CD
Value Stream Mapping often reveals that continuous integration and continuous delivery (CI/CD) pipelines suffer from hidden inefficiencies. While teams may assume their CI/CD framework operates smoothly, systematic analysis exposes friction throughout pipeline stages.
VSM helps pinpoint CI bottlenecks such as long-running build queues, unoptimized container compilation, and sequential pipeline execution steps that could run in parallel. It highlights flaky automated tests that fail unpredictably, forcing teams to re-run builds manually and wasting developer time.
Unoptimized Pipeline:
[ Compile ] ---> [ Unit Test ] ---> [ Integration Test ] ---> [ Security Scan ] ---> [ Manual Deploy ]
(Sequential execution creates long feedback loops)

Optimized Pipeline (Via VSM Findings):
[ Compile ] ---+---> [ Unit Test ] --------+---> [ Automated Deploy ]
               +---> [ Integration Test ] --|
               +---> [ Security Scan ] -----+
(Parallel execution minimizes pipeline cycle time)
Mapping the pipeline exposes hidden manual interventions, such as manual artifact uploads, manual staging promotions, or sign-offs embedded between pipeline stages. It also highlights environment availability issues, such as pipeline agents failing to provision isolated infrastructure instances dynamically.
By applying VSM findings to CI/CD ecosystems, engineering organizations can restructure linear workflows into parallel pipelines, optimize artifact caching, quarantine unreliable test scripts, and transition manual verification gates into automated checks.
Value Stream Mapping and Automation
While Value Stream Mapping highlights operational waste, automation serves as a primary mechanism to streamline execution. However, blindly automating inefficient processes only speeds up poorly planned workflows. VSM ensures teams automate the right operations.
Target high-impact automation areas identified through mapping:
- Build Automation: Compiling application assets, resolving dependencies, and packaging artifacts automatically upon code commits.
- Test Automation: Running unit, integration, and performance tests automatically inside CI/CD execution pathways.
- Deployment Automation: Releasing software updates reliably to target staging and production environments without manual intervention.
- Infrastructure Automation: Provisioning dynamic compute, network, and storage components automatically using Infrastructure as Code (IaC).
- Security Automation: Scanning source code, third-party libraries, and container images for security flaws during build stages.
- Environment Provisioning: Spinning up isolated, production-like testing environments dynamically on demand.
- Monitoring Automation: Instrumenting observability agents, configuring alerts, and executing self-healing actions automatically during deployment.
Not every manual step should be automated immediately. Highly complex, rarely executed steps or tasks requiring human evaluation may deliver a low return on automation investment. Focus automation efforts on repetitive, high-frequency, prone-to-error processes that cause severe delivery delays.
Value Stream Mapping and DevSecOps
Security practices often become delivery bottlenecks when treated as an afterthought at the end of the development lifecycle. Value Stream Mapping highlights the friction caused by late security reviews and helps transition organizations toward integrated DevSecOps models.
Traditional Security Approach:
[ Dev ] ---> [ Build ] ---> [ Test ] ---> [ Production Queue ] ---> [ Security Audit ] (BLOCKED)

DevSecOps Shift-Left Approach:
[ Dev + SAST Scan ] ---> [ Build + Container Scan ] ---> [ Automated Compliance Gate ] ---> [ Deploy ]
Code language: CSS (css)
Key security practices to integrate directly into the value stream include:
- Static Application Security Testing (SAST): Scanning source code for vulnerabilities inside developer IDEs and CI pipelines.
- Dependency Scanning: Identifying known vulnerabilities in open-source libraries during build steps.
- Secrets Detection: Preventing credentials, API tokens, and private keys from entering source repositories automatically.
- Infrastructure as Code (IaC) Scanning: Validating Terraform and CloudFormation configurations against security baselines before provisioning.
- Container Scanning: Analyzing container image layers for security risks before deployment.
- Compliance Checks: Enforcing corporate regulatory policies automatically using Policy-as-Code tooling.
- Automated Security Approvals: Replacing manual sign-off queues with policy-based CI gates for low-risk changes.
By visualizing security activities on a value stream map, teams shift security checks earlier into the delivery cycle (“shift left”). This approach eliminates late-stage security blocks while keeping systems compliant and secure.
Value Stream Mapping and SRE
Site Reliability Engineering (SRE) prioritizes system availability, fault tolerance, and operational resilience. While feature delivery focuses on code velocity, SRE ensures production systems remain stable and performant under load.
Value Stream Mapping reveals how reliability practices interact with active code delivery:
- Production Readiness Reviews: Verifying service health, monitoring, and operational runbooks before production releases.
- Observability Instrumentation: Injecting tracing metrics, structured logs, and performance telemetries during development stages.
- Reliability Testing: Executing chaos experiments, load testing, and failure injection within staging pipelines.
- Incident Response & Recovery: Tracking operational feedback loops to reduce Mean Time to Detect (MTTD) and Mean Time to Restore (MTTR).
- Error Budgets: Using remaining error budget levels to automatically permit or restrict aggressive deployment schedules.
- Post-Incident Learning: Converting incident root-cause findings into backlog items to prevent operational regressions.
Reliability work contributes directly to long-term business value. Unstable applications cause frequent production outages, which trigger紧急 hotfixes and derail feature delivery pipelines. VSM helps teams balance rapid delivery features against core system stability.
Current-State vs Future-State Value Stream Map
Value Stream Mapping relies on analyzing two distinct pipeline models: the current-state map and the future-state map.
Current-State Map (Observed Operational Reality):
- Identifies current delays, manual checks, handoff gaps, and bottlenecks.
- Captures real baseline metrics.

                     ||
                     ||  Improvement Initiatives
                     \/

Future-State Map (Designed Operational Target):
- Eliminates non-value-added waste and automates target stages.
- Serves as a target hypothesis for continuous optimization.
Code language: JavaScript (javascript)| Area | Current State | Future State |
| Development | Manual local environment setup, long feature branches | Standardized containerized environments, trunk-based development |
| Testing | Manual QA verification on shared staging environments | Automated integration test execution in dynamic, ephemeral preview environments |
| Security | Manual security reviews at release completion | Automated SAST, container, and secrets scanning embedded directly in CI pipelines |
| Infrastructure | Manual ticketing system requests for cloud infrastructure | Self-service platform automation using IaC infrastructure modules |
| Deployment | Off-hours manual releases with long Change Advisory Board sign-offs | Automated canary and blue-green deployments controlled by pipeline gates |
| Monitoring | Reactive manual triage driven by user bug reports | Proactive telemetry, automated alerting, and dynamic error budget enforcement |
| Feedback | Delayed quarterly product reviews and user surveys | Continuous real-time user metrics, trace logging, and automated failure feedback |
Treat the future-state value stream map as an evolving hypothesis rather than a static design. As delivery pipelines change and new bottlenecks emerge, update the future-state map to drive ongoing operational improvements.
How to Prioritize Improvements
Identifying bottlenecks across a value stream map can reveal dozens of potential optimization targets. Engineering teams must prioritize high-impact improvements to avoid spreading effort across minor, low-value fixes.
Evaluate improvement candidates against these practical criteria:
- Customer Impact: Does resolving this bottleneck accelerate value delivery to end users?
- Delivery Delay: How much overall lead time is lost to this specific waiting queue or manual block?
- Frequency: How often does this issue delay software releases?
- Risk: What is the risk profile of changing or automating this stage?
- Engineering Effort: How much engineering labor is required to implement the fix?
- Dependency: Must other architectural or process changes occur before tackling this issue?
| Priority | Example Problem | Improvement Approach |
| P1 (High Impact, Low Effort) | PRs sit idle for days waiting for initial code reviews | Enforce pull request size limits and set automated review notifications |
| P2 (High Impact, High Effort) | Shared staging server causes bottlenecking across teams | Build automated, containerized preview environment pipelines using IaC |
| P3 (Low Impact, Low Effort) | Manual status updates are typed into ticketing systems | Connect CI/CD deployment hooks to update ticket statuses automatically |
| P4 (Low Impact, High Effort) | Ancient legacy subsystem takes 4 hours to compile | Defer re-architecture until the component requires active feature development |
Common Value Stream Mapping Mistakes
Organizations frequently make strategic errors when applying Value Stream Mapping to DevOps pipelines.
Mapping the Ideal Process Instead of the Real Process
Teams often document the process documented in standard operating manuals rather than mapping how work actually gets done.
- Solution: Base maps strictly on observed workflow data, ticket timestamps, and direct team interviews.
Mapping Only One Team
Focusing strictly on developer coding workflows ignores significant downstream delays in QA, compliance, security, and operations.
- Solution: Map the entire value stream across all teams, from initial business request to production delivery.
Ignoring Waiting Time
Teams spend massive effort trying to optimize active coding execution times while ignoring multi-week waiting queues between handoff stages.
- Solution: Explicitly track idle duration between pipeline stages on the value stream map.
Ignoring Rework
Failing to track rework loops (e.g., failed tests returned to development) masks deep underlying pipeline inefficiencies.
- Solution: Measure failure rates at every stage and record total time lost to rework loops.
Measuring Everything
Gathering hundreds of detailed metrics creates data overload and obscures core delivery constraints.
- Solution: Track core flow metrics (lead time, cycle time, processing time, change failure rate) to expose main bottlenecks.
Treating People as Bottlenecks
Blaming developers or QA staff for slow execution creates defensive cultures and masks structural, systemic delays.
- Solution: Focus on process flaws, handoff friction, environment gaps, and system design rather than individual performance.
Focusing Only on Automation
Attempting to automate broken, redundant workflows accelerates the generation of flawed releases.
- Solution: Simplify, streamline, and optimize stages before introducing automation tools.
Creating a Map and Never Using It
Treating Value Stream Mapping as an isolated documentation project guarantees zero long-term impact.
- Solution: Revisit the value stream map quarterly to track progress against your future-state targets.
Blaming Teams Instead of Improving Systems
Using value stream performance data to criticize specific functional groups destroys trust and team collaboration.
- Solution: Frame mapping sessions as cross-functional problem-solving workshops focused on systemic flow optimization.
Ignoring Business Outcomes
Optimizing velocity without aligning to business requirements results in delivering unwanted software features faster.
- Solution: Ensure your value stream links engineering release speed directly to business metrics and customer satisfaction.
Value Stream Mapping Workshop for DevOps Teams
Conducting a collaborative mapping workshop is the most effective way to analyze software delivery pipelines and align cross-functional teams around operational improvements.
Workshop Participants:
[ Product ] + [ Dev ] + [ QA ] + [ Security ] + [ SRE/Ops ] + [ Management ]
                                    |
                                    v
                     +------------------------------+
                     | Value Stream Mapping Session |
                     +------------------------------+
                                    |
            +-----------------------+-----------------------+
            |                                               |
  (Current-State Analysis)                       (Future-State Planning)
  - Map workflow & handoffs                       - Identify automation targets
  - Record processing/wait time                   - Establish priority roadmap
Code language: JavaScript (javascript)
Required Participants
To capture a full delivery system accurately, assemble a representative cross-functional team:
- Software Developers
- DevOps Engineers
- QA / Test Automation Engineers
- Security Specialists
- Platform / SRE Engineers
- Product Managers
- IT Operations Staff
- Engineering Management
Workshop Execution Structure
1. Before the Workshop
Gather operational baseline data beforehand. Pull ticket timestamp metrics, repository PR logs, and build historical trends from ticketing systems, Git platforms, and CI tools to ground the discussion in real data.
2. During the Workshop
- Step A: Map the Current State: Place sticky notes or digital cards representing each process stage, handoff point, and approval step from initial requirement to production release.
- Step B: Add Empirical Metrics: Record estimated or measured processing times and waiting periods below each stage.
- Step C: Identify Bottlenecks & Waste: Encourage participants to place visual callouts on stages causing severe friction, rework loops, or queueing delays.
- Step D: Design the Future-State Map: Collaboratively re-architect the delivery stream to eliminate non-value-added waste and streamline handoffs.
3. After the Workshop
- Convert workshop outputs into a clear action plan containing prioritized improvement initiatives.
- Assign explicit ownership and timelines to initial engineering backlog tasks.
- Schedule recurring reviews to track progress against your target metrics.
Value Stream Mapping Checklist
Use this practical checklist to ensure your Value Stream Mapping initiative covers every key operational step:
- Value stream scope and customer outcome are clearly defined
- Representative work item (e.g., standard feature ticket) is selected
- All actual process stages are documented based on real observed workflows
- Internal and external team handoffs are identified
- Waiting time between each operational stage is measured
- Active processing time for each stage is measured
- Rework loops, failures, and defect return rates are recorded
- System bottlenecks constraining total flow are documented
- Practical automation opportunities are identified and evaluated
- Security checks and compliance verification steps are mapped
- Site Reliability Engineering and production readiness checks are included
- Actionable improvement priorities are selected based on effort and impact
- Future-state value stream map target design is finalized
- Re-measurement schedules are planned to validate improvements continuously
Value Stream Mapping Tools and Approaches
Engineering teams can choose from simple collaboration tools to dedicated analytical platforms based on their operational scale.
| Tool / Approach | Purpose | Best Used For |
| Physical Whiteboard & Sticky Notes | In-person collaborative workflow mapping | Initial cross-functional mapping workshops |
| Digital Collaboration Boards (Miro, Mural) | Remote visual mapping and process design | Distributed engineering team workshops |
| Spreadsheets (Excel, Google Sheets) | Baseline metric tracking, time calculations | Aggregating processing and waiting times manually |
| Issue Tracker Data (Jira, GitHub Issues) | Extracting ticket timestamps and transition data | Gathering real historical lead and cycle times |
| CI/CD Pipeline Analytics | Tracking build, execution, and deployment durations | Analyzing pipeline execution performance |
| Observability Data (Datadog, Grafana) | Monitoring application health and release deployments | Capturing deployment durations and production failure metrics |
| Value Stream Analytics Platforms | End-to-end automated pipeline flow tracking | Enterprise-scale automated delivery analytics |
Teams should start with simple whiteboard or digital collaboration tools during initial mapping workshops. Advanced value stream analytics platforms can be introduced later as pipeline complexity and scaling demands grow.
Career Value of Understanding Value Stream Mapping
Mastering Value Stream Mapping elevates an engineer’s perspective from executing isolated tasks to optimizing end-to-end delivery systems. Understanding overall system flow is a defining skill for senior technical leadership roles.
| Role | Value Stream Mapping Skills Applied |
| DevOps Engineer | Identifies CI/CD pipeline bottlenecks and automates manual deployment handoffs |
| SRE / Platform Engineer | Integrates reliability gates and builds self-service platform infrastructure |
| DevOps Consultant | Audits enterprise delivery pipelines and designs targeted transformation roadmaps |
| Engineering Manager | Eliminates team delivery blockers, reduces lead time, and improves operational throughput |
| Product Manager | Aligns feature backlog planning with actual delivery capacity and pipeline constraints |
| Technical Leader | Re-architects organizational engineering processes around system flow principles |
Senior engineers must look beyond application code and server configurations to master how work moves through an enterprise. Applying systems thinking transforms technical contributors into high-impact engineering leaders.
DevOps Learning Roadmap
Mastering Value Stream Mapping requires a strong foundation across modern software delivery disciplines.
[ DevOps Fundamentals ]
          ↓
[ Software Delivery Lifecycle ]
          ↓
[ Git & Collaboration ]
          ↓
[ Continuous Integration & Continuous Delivery ]
          ↓
[ Cloud & Infrastructure as Code ]
          ↓
[ Automation Frameworks ]
          ↓
[ Observability & Telemetry ]
          ↓
[ DevSecOps Integration ]
          ↓
[ Value Stream Mapping ]
          ↓
[ Continuous Improvement Culture ]
Code language: CSS (css)
1. DevOps Fundamentals
Master core principles around collaboration, shared operational responsibility, iterative releases, and Lean software delivery concepts.
2. Software Delivery Lifecycle
Understand how business ideas transition through requirements gathering, development, testing, release management, and operational maintenance.
3. Git & Collaboration
Learn version control practices, trunk-based development, feature branching strategies, and pull request workflows.
4. Continuous Integration & Continuous Delivery
Build reliable automated pipelines that compile code, execute automated test suites, build container images, and deploy software releases.
5. Cloud & Infrastructure as Code
Master automated infrastructure provisioning using cloud platforms and tools like Terraform, Ansible, and Kubernetes.
6. Automation Frameworks
Learn to automate repetitive tasks, environment setups, testing workflows, and pipeline deployments using dynamic scripts.
7. Observability & Telemetry
Implement tracing, metrics collection, structured logging, and automated alert monitoring across application stacks.
8. DevSecOps Integration
Embed automated security tools (SAST, DAST, container scanning, secrets detection) directly into software delivery pipelines.
9. Value Stream Mapping
Analyze end-to-end delivery systems, gather workflow metrics, identify operational bottlenecks, and eliminate system waste.
10. Continuous Improvement Culture
Iteratively improve systems using empirical metrics, operational post-mortems, and collaborative cross-functional feedback loops.
Frequently Asked Questions
What is Value Stream Mapping in DevOps?
Value Stream Mapping in DevOps is a visual, analytical practice used to track, measure, and optimize the flow of work from an initial feature request through development, testing, security, and deployment into production.
Why is Value Stream Mapping important for DevOps teams?
VSM provides objective visibility across the entire software delivery pipeline. It helps teams identify manual handoff delays, continuous waiting periods, and operational bottlenecks so they can target high-impact improvements.
What is a value stream?
A value stream is the end-to-end sequence of processes and activities required to deliver a feature, application update, or technical service to an end customer.
What is the difference between lead time and cycle time?
Lead time measures the total duration from initial request creation to production delivery. Cycle time measures the duration from when active development starts on a task until it reaches production.
How do you create a DevOps value stream map?
Define your scope, map every actual stage and handoff point, measure processing and waiting times using historical data, pinpoint primary bottlenecks and waste, and design a streamlined future-state map.
What metrics are used in Value Stream Mapping?
Key metrics include Lead Time, Cycle Time, Processing Time, Waiting Time, Deployment Frequency, Change Failure Rate, Queue Duration, and Rework Percentage.
How does VSM identify DevOps bottlenecks?
VSM isolates stages that accumulate long waiting queues, high failure rates, or long processing times, exposing the primary constraints limiting overall system velocity.
Can Value Stream Mapping improve CI/CD?
Yes. VSM identifies long build times, sequential test queues, flaky test runs, manual release gates, and dynamic environment provisioning delays within CI/CD pipelines.
How does VSM work with DevSecOps?
VSM maps security and compliance verification steps across the delivery pipeline, highlighting where late-stage security audits cause release blocks and helping teams shift security checks earlier into CI pipelines.
What is the difference between current-state and future-state mapping?
A current-state map visualizes the existing delivery workflow and its operational inefficiencies. A future-state map designs an optimized workflow target that eliminates identified waste and automates target stages.
What are common Value Stream Mapping mistakes?
Common errors include mapping ideal processes instead of actual practice, ignoring waiting time between handoffs, treating staff as individual bottlenecks, and treating mapping as a one-time exercise rather than a continuous process.
Can beginners learn Value Stream Mapping?
Yes. Beginners can start by mapping simple workflows on a whiteboard, capturing active processing and waiting durations, and identifying manual handoff delays between functional roles.
Final Thoughts
Value Stream Mapping is most effective when used to evaluate the complete end-to-end flow of software delivery rather than judging isolated team performance. Optimizing individual developers or operational teams yields minimal results if work items spend weeks sitting idle in handoff queues, approval delays, and environment blocks. The goal of mapping is not to assign blame for delays, but to understand systemic constraints, eliminate non-value-added waste, and introduce thoughtful, metrics-driven improvements that yield sustainable long-term outcomes.

Find Trusted Cardiac Hospitals
Compare heart hospitals by city and services — all in one place.
Explore Hospitals
One thing worth keeping in mind with VSM is that improving a single step doesn’t always improve the entire delivery process. A faster testing stage, for instance, can create more pressure on deployment or operations if those teams are already at capacity. Looking at the complete flow and downstream impact helps ensure optimization actually reduces overall delivery time.