Introduction
There is a specific kind of dread that every on-call engineer knows. It is 2:47 AM. Your phone is screaming. Latency on the checkout service has spiked, error rates are climbing, and your Grafana dashboard looks like a Jackson Pollock painting. You have logs. You have metrics. You have traces. You have, by most definitions, complete observability. And yet you are staring at 40,000 log lines per second, a dozen alert channels firing simultaneously, and absolutely no idea where to start.
This is the central paradox of modern observability. We have never had more data. We have also never had more trouble making sense of it.
AI-assisted observability is not a marketing category. It is an operational response to a genuine scaling problem, one that teams running microservices at any meaningful size eventually hit. This article walks through what it actually means to integrate AI into your observability workflow, where it adds real value, where it falls short, and how to build something that holds up in production.
The Growing Challenge of Log Overload
A monolithic application from ten years ago might generate a few hundred megabytes of logs per day. A modern Kubernetes-based microservices deployment can easily produce hundreds of gigabytes. Add distributed tracing spans, Prometheus metrics scraped every fifteen seconds, and custom application events, and you are operating a data pipeline that rivals some analytics platforms in raw volume.
The math just does not work anymore. Even with excellent tooling — Elasticsearch or OpenSearch for storage, Kibana or Grafana for visualization, and alerting through Alertmanager or PagerDuty — the human brain cannot process signal at that scale. Engineers end up in one of two failure modes: alert fatigue from too many notifications, or blind spots from dashboards that nobody actually reads.
What makes this worse is the correlation problem. A symptom appears in the application layer. The root cause lives in a network policy change that happened two hours earlier. The evidence is there across your logs, your traces, and your metrics — but connecting those dots manually, during an incident, under pressure, is unreliable even for experienced engineers.
Why Traditional Log Analysis No Longer Scales
The standard approach to log analysis follows a predictable pattern. You define some search queries in Kibana. You build dashboards around known failure modes. You write alerting rules based on error patterns your team has seen before. Then you wait for something new to break.
The problem is that traditional log analysis is inherently reactive and pattern-bound. It can only find what you told it to look for. A new type of failure, a memory leak introduced by a dependency update, a cascade triggered by an unusual traffic distribution, a slow disk on one node in a StatefulSet, will not match your existing queries. You will not catch it until a user reports it.
There is also the signal-to-noise ratio problem. In a large Kubernetes cluster, a Pod crash-looping generates hundreds of identical log lines before anyone notices. A noisy third-party library floods your log index with debug output that obscures real errors. Engineers spend enormous amounts of time tuning log levels, rotating indexes, and managing retention policies, time that would be better spent on reliability work.
Traditional static rules simply cannot adapt fast enough to dynamic environments. Kubernetes clusters reschedule Pods. Services get redeployed dozens of times per day. The infrastructure topology changes constantly. An alerting rule that was appropriate last month may be irrelevant or misleading today.
How AI Changes the Observability Workflow
The shift that AI introduces is moving from pattern-matching to pattern-discovery. Instead of telling the system what to look for, you let statistical models and language models identify what is unusual, what correlates with what, and what most likely explains a given set of symptoms.
This sounds abstract, so it helps to make it concrete. Consider anomaly detection on a latency metric. A static threshold alert fires when p99 latency exceeds 500ms. A machine learning model trained on historical data can instead detect when p99 latency is behaving unusually for this time of day, this day of week, and this traffic volume, even if the absolute value is well within your static thresholds. That is a fundamentally different and more useful capability.
On the log analysis side, large language models can do something that no traditional tool does well: read a block of log output and tell you, in plain language, what it means. An LLM given a set of correlated log entries across three services can draft a summary of what happened, in what order, and which component appears to be the source. This does not replace an engineer’s judgment, but it dramatically compresses the time to initial hypothesis.
The key word is “assists.” AI-assisted observability works best when it is positioned as an accelerator for human decision-making, not a replacement for it.
Key Capabilities of AI-Assisted Observability
Intelligent Log Clustering
Rather than searching for specific strings, clustering algorithms group log entries by semantic similarity. DBSCAN and k-means approaches can identify that 80% of your current log volume is one repeating error pattern, and surface the other 20% for human review. Tools like Coralogix and Dynatrace use variations of this. You can also build it yourself using embedding models over a log stream piped through an OpenTelemetry collector.
The practical benefit: instead of scrolling through 50,000 lines, an engineer reviews 15 representative clusters. The volume problem is still there at the infrastructure level, but it no longer overwhelms the human layer.
Anomaly Detection
Statistical anomaly detection on metrics is mature technology. What has improved significantly is multivariate anomaly detection, identifying that a simultaneous shift in request rate, memory usage, and database connection pool size across three services is a correlated event, not three independent incidents.
Prometheus with external ML layers (or purpose-built tools like Grafana’s Machine Learning plugin) can flag these compound anomalies. The challenge is tuning sensitivity. Too aggressive and you recreate alert fatigue. Too conservative and you miss real events. Most teams find they need 2-3 weeks of baseline data before anomaly detection becomes genuinely useful.
Root Cause Analysis Assistance
Root cause analysis (RCA) is where AI adds the most value and also where expectations need the most careful management. Current AI-assisted RCA tools can significantly narrow the search space: given an incident start time and affected services, they can correlate changes in metrics, recent deployments, config changes, and upstream dependency behavior to produce a ranked list of probable causes.
What they cannot reliably do is definitively identify the root cause in complex distributed systems where causality is genuinely ambiguous. A good mental model is to think of AI-assisted RCA as a very experienced first responder who has seen thousands of incidents. They will point you in the right direction. They will not always be right, and they cannot replace the judgment of an engineer who understands your specific system’s quirks.
Incident Summarization
This is arguably the most immediately practical capability. Using LLMs, teams can generate incident timelines automatically — pulling in alerts, log snippets, trace data, and deployment events, then producing a coherent narrative of what happened. This is valuable both during an incident (to onboard responders quickly) and after (to accelerate postmortem writing).
Engineers building custom observability assistants often integrate external AI inference APIs to process incident data, summarize logs, and enrich troubleshooting workflows, feeding structured context from their observability pipeline into a language model endpoint and getting back human-readable summaries without building and hosting inference infrastructure themselves.
Noise Reduction
Perhaps the most underappreciated capability. AI-based noise reduction learns which alerts are consistently followed by human acknowledgment without action, a strong signal that the alert is low-value. Over time, it can automatically suppress, group, or deprioritize these notifications. PagerDuty’s AIOps features do this. Moogsoft and BigPanda have made it their core product. The reduction in mean time to acknowledge genuine incidents can be substantial.
Practical Use Cases
Kubernetes Troubleshooting
Kubernetes generates a dense volume of events, controller logs, and scheduler decisions. When a Deployment fails to roll out, the evidence is spread across Pod events, the ReplicaSet controller logs, kubelet logs on the node, and potentially the API server audit log. An AI-assisted observability layer can ingest all of these, recognize the failure pattern (image pull failure, OOMKilled, PodAffinity conflict, and so on), and surface a clear summary rather than forcing the engineer to correlate manually across kubectl describe, kubectl logs, and the events API.
We ran this at a previous employer on a 200-node cluster and the reduction in time-to-diagnosis for common failure modes was significant. Unusual failures still required deep manual investigation, but the mundane ones, which make up the bulk of operational work, became much faster to resolve.
Microservices Environments
Distributed tracing with OpenTelemetry has improved dramatically, but trace data is only useful if engineers can navigate it. In a service mesh with forty services, a single user request can generate a trace with hundreds of spans. AI-assisted analysis can identify which spans contributed most to elevated latency, surface spans where error rates changed relative to the baseline, and prioritize which services an engineer should investigate first.
Correlating this trace data with corresponding log output and Prometheus metrics, the “three pillars” correlation that every observability vendor talks about, is where AI provides the most acceleration. Doing it manually is slow and error-prone.
CI/CD Failure Analysis
Build and deployment failures are a significant source of engineering friction, and they generate structured data that AI handles well. Log output from a failed test suite, a Docker build failure, or a Helm deployment error follows consistent patterns. LLMs fine-tuned or prompted with your CI tool’s output format can classify failures (dependency issue, test regression, infrastructure timeout, configuration error), identify which recent code change most likely caused the failure, and suggest remediation steps.
This is particularly useful in organizations where not every team member is deeply familiar with the CI infrastructure. A clear natural-language explanation of why a build failed is more accessible than raw pipeline logs.
Cloud Infrastructure Monitoring
Cloud infrastructure — VMs, managed databases, load balancers, VPC networking — generates operational events that are useful for troubleshooting but difficult to query reactively. AI-assisted monitoring can maintain a continuous baseline of normal infrastructure behavior and alert on deviations that cross-correlate with application-level symptoms. An RDS instance showing elevated I/O wait that coincides with increased query latency in your application traces is a useful signal to surface proactively, even if neither metric independently crossed a static threshold.
Architecture Example: AI-Augmented Observability Pipeline
Here is a reference architecture for teams looking to build this capability incrementally.
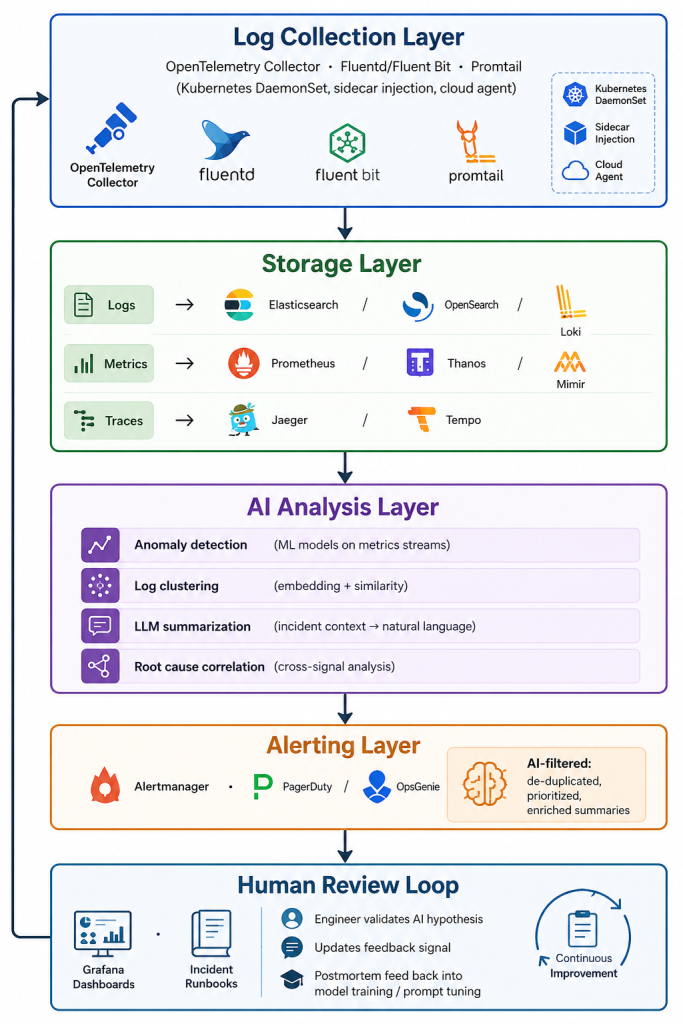
The human review loop deserves emphasis. In every successful implementation of AI-assisted observability I have seen, the feedback mechanism is what separates a useful system from one that gradually loses engineer trust. When an AI hypothesis is wrong, that signal needs to feed back into the system, whether that means retraining a model, adjusting alert thresholds, or updating the prompts used for LLM summarization.
Build the feedback loop from the start. Retrofitting it later is painful.
What AI-assisted observability does well:
- Reduces time-to-hypothesis during incidents
- Handles alert volume that would overwhelm human operators
- Surfaces correlations across signals that are difficult to spot manually
- Generates useful narrative summaries for incident response and postmortems
- Adapts to changing baselines without constant manual threshold tuning
Where it falls short:
- Novel, complex failure modes in highly customized systems still require deep human expertise
- AI models can be confidently wrong. An LLM-generated incident summary that misidentifies the root cause can send an engineer down the wrong path for 30 minutes during an outage — which is expensive
- Training and tuning requires operational investment. Generic models applied to your specific environment without customization tend to produce high false-positive rates early on
- Cost at scale. Running ML inference over high-cardinality log streams is not free. Budget accordingly
One operational lesson: treat AI-generated insights as a starting hypothesis, not a conclusion. The best on-call engineers I have worked with use AI-assisted tooling the way they use search results — as a starting point for investigation, not as an answer.
Best Practices for Adoption
Start with noise reduction before adding complexity. Alert fatigue is the most universally painful problem in observability. AI-based deduplication and suppression of low-value alerts has a high success rate and low risk. It is a good first deployment.
Use OpenTelemetry as your instrumentation standard. If your telemetry collection is fragmented across vendor agents and custom shippers, AI analysis layers cannot work well because the data schema is inconsistent. Standardize on OTel before investing heavily in AI analysis.
Establish baselines before expecting anomaly detection to work. Two to four weeks of normal operational data significantly improves the accuracy of anomaly detection models. Deploying anomaly detection on a freshly instrumented environment and expecting immediate results is a recipe for disillusionment.
Instrument your AI layer’s performance. Track false positive rate, mean time to correct hypothesis, and engineer satisfaction with AI-generated suggestions. Without metrics on the AI layer itself, you cannot improve it.
Do not automate remediation without extensive testing. AI-assisted observability and automated remediation are separate concerns. Many teams conflate them. Automatically restarting a Pod based on an AI-identified anomaly sounds efficient until the anomaly is actually a symptom of data corruption that restarting will not fix and may make worse.
Future of AI in Observability
The near-term trajectory is toward what some teams are calling “conversational observability” — the ability to ask your observability platform questions in natural language and get answers grounded in your actual telemetry data. Instead of building a Kibana query for level:error AND service:payments AND NOT exception:timeout, you ask: “What errors has the payments service had in the last hour that are different from its normal pattern?” The underlying query is generated and executed automatically.
This is already possible with current technology. The gap is mostly in integration and product maturity. Connecting a language model reliably to live Prometheus, Elasticsearch, and Tempo data in a way that is fast enough to be useful during an incident is an engineering problem that vendors and open-source projects are actively working on.
Longer term, the interesting question is whether AI can move observability from reactive to predictive, not just explaining failures after they happen, but identifying precursor patterns that indicate elevated risk. Some work in this space is promising, particularly for well-understood failure modes like memory leak trajectories and disk saturation. Genuinely novel failure prediction remains research-grade.
What will not change is the fundamental need for engineers who understand their systems deeply. AI-assisted observability is most effective in the hands of people who can evaluate its output critically. The value is in compression and acceleration, not in replacing the judgment that comes from operational experience.
Conclusion
Log overload, alert fatigue, and the difficulty of correlating signals across distributed systems are not new problems. What is new is having practical tools to address them at operational scale.
AI-assisted observability, applied thoughtfully, genuinely reduces the cognitive load on engineering teams. It surfaces relevant signals faster, generates useful starting points for incident investigation, and adapts to changing infrastructure in ways that static alerting rules never could.
The teams that get the most out of it treat it as an augmentation to their existing workflows, integrating AI-generated insights into Grafana dashboards they already use, enriching PagerDuty alerts they already receive, and feeding LLM-generated summaries into runbooks they already follow. The teams that struggle tend to treat it as a replacement for the observability fundamentals: solid instrumentation, clear ownership, and engineers who understand the systems they run.
Get the fundamentals right first. Then let AI help you move faster on top of them.
I’m Rajesh Kumar, a DevOps, SRE, DevSecOps, Cloud, and Platform Engineering expert passionate about sharing practical knowledge, real-world experiences, and industry best practices. I have worked at Cotocus and regularly write about technology, travel, investing, health, product reviews, and digital marketing through my various platforms.
I publish technical articles at DevOps School, travel stories at Holiday Landmark, stock market insights at Stocks Mantra, health and fitness guidance at My Medic Plus, product reviews at TrueReviewNow, and SEO and digital marketing strategies at Wizbrand.
Find Trusted Cardiac Hospitals
Compare heart hospitals by city and services — all in one place.
Explore Hospitals
A missing but important angle here is the reliability problem of AI-assisted observability itself. Turning logs into “actionable insights” sounds powerful, but in production environments, false positives, incomplete context, and hallucinated root-cause suggestions can create operational fatigue instead of reducing it. In my experience, AI becomes genuinely useful only after teams standardize structured logging, trace correlation, service metadata, and deployment context (version, region, dependency map). Otherwise, the system risks becoming an expensive summarization layer over noisy telemetry. A practical next step for teams is to treat AI observability like any production system: measure precision of recommendations, track investigation success rates, and continuously validate whether suggested actions actually reduced MTTR rather than just producing better-looking dashboards.