Here’s a presentation of some common and effective Root Cause Analysis (RCA) tools, visually illustrated for clarity:
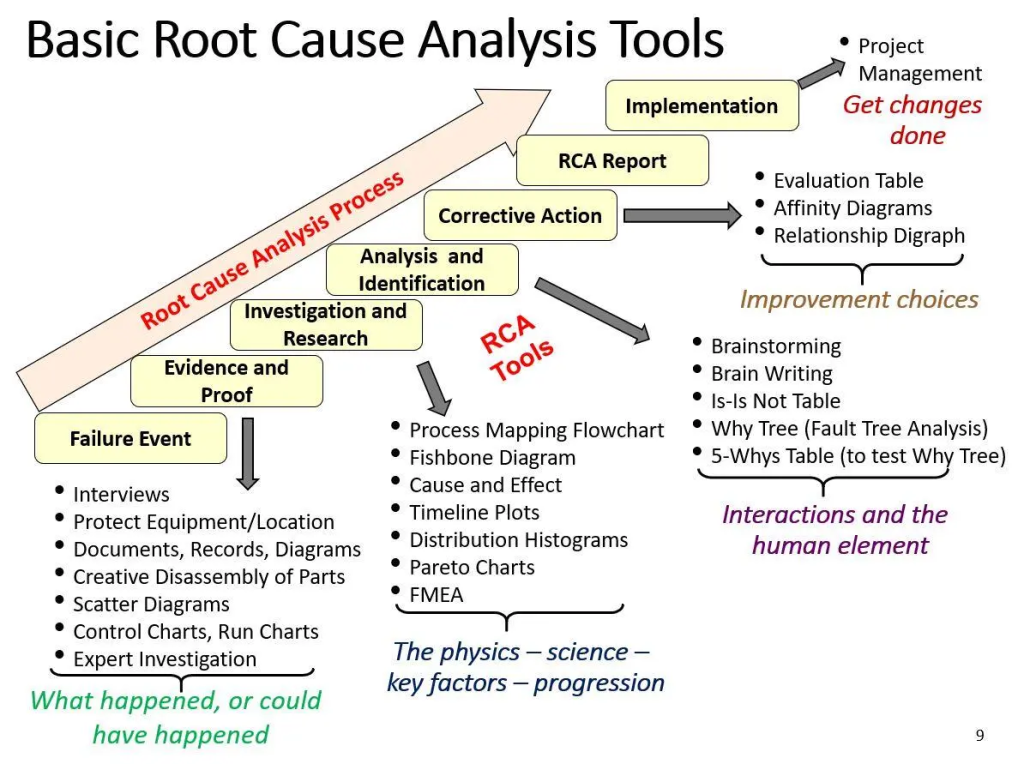
1. 5 Whys:
- Description: Repeatedly ask “why?” (frequently 5 times) to unhide the root cause beneath a problem’s surface.
2. Fishbone Diagram (Ishikawa Diagram):
- Description: Visually categorize potential causes into branches like machines, methods, materials, people, and environment.
3. Pareto Chart:
- Description: A bar graph prioritizing the most significant causes based on frequency or cost.
4. Failure Mode and Effects Analysis (FMEA):
- Description: Proactively identify potential failure modes, their causes, and potential effects.
5. Fault Tree Analysis (FTA):
- Description: Visualize the logical relationships between events leading to system failure.
6. Scatter Diagram:
- Description: Graph the relationship between two variables to uncover potential correlations and root causes.
7. Current Reality Tree (CRT):
- Description: (Theory of Constraints) Analyze complex systems to identify the underlying cause of undesirable events.
Choosing the Right RCA Tool:
The optimal tool depends on:
- Problem complexity: Simple or intricate?
- Available data: Type of data to analyze?
- Team expertise: Familiarity with RCA tools?
- Resources: Time and budget for the process?

Find Trusted Cardiac Hospitals
Compare heart hospitals by city and services — all in one place.
Explore Hospitals
This blog offers a simple and practical overview of Root Cause Analysis (RCA) tools in 2024. I appreciate how it breaks down methods like the 5 Whys and Fishbone Diagram in an easy-to-follow way. It’s a useful read for anyone looking to better understand how to find the root of issues and improve problem-solving processes.