
Introduction
Modern enterprise applications continuously evolve through ongoing code deployments, microservice interactions, and shifting user patterns, making pre-release staging environments insufficient for anticipating every real-world edge case, network latency issue, or infrastructure degradation. While traditional Shift-Left practices prevent early code defects, relying solely on pre-deployment testing leaves teams vulnerable to unpredicted production failure modes. Adopting a Shift-Right approach in software delivery extends quality assurance, resilience testing, and real-time observability into live environments, allowing engineering teams to capture actual user insights, minimize blast radiuses during rollouts, and transition from reactive firefighting to continuous, data-driven system optimization—a discipline thoroughly supported by hands-on cloud-native learning platforms like DevOpsSchool.
What Is Shift-Right in DevOps?
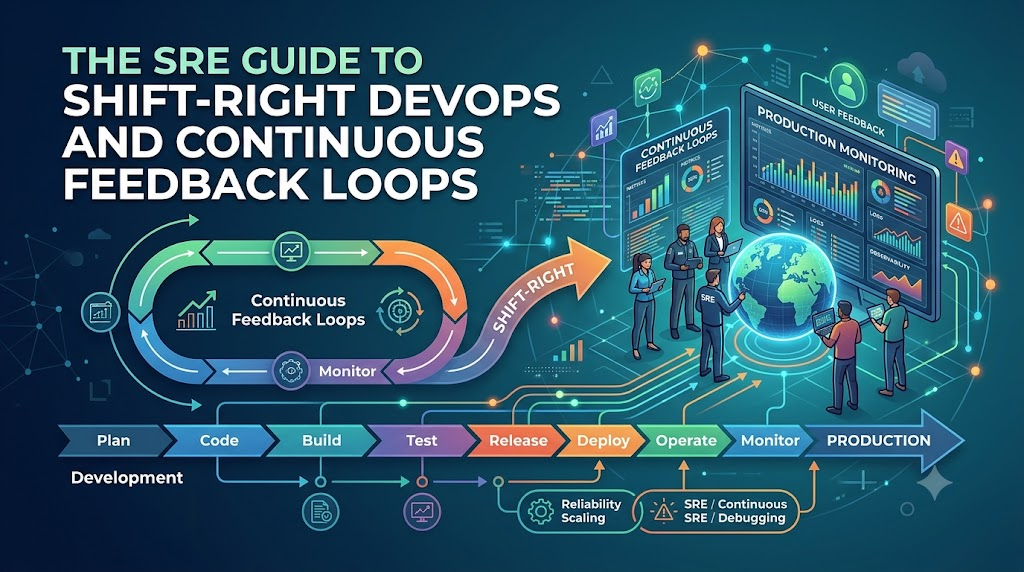
Shift-Right in DevOps is an operational philosophy that extends testing, monitoring, quality assurance, and feedback collection into live production environments. Rather than assuming a release is complete once code passes CI/CD pipeline checks and deploys, Shift-Right treats production as a continuous source of operational insights and validation.
+-----------------------------------------------------------------------------------+
|                            CONTINUOUS DELIVERY LIFECYCLE                          |
+-----------------------------------------------------------------------------------+
|        SHIFT-LEFT PRACTICES                 |        SHIFT-RIGHT PRACTICES        |
|  (Pre-Deployment Validation)               |  (Post-Deployment Verification)      |
|                                            |                                      |
|  [Code] -> [Static Analysis] -> [Unit Test] |  [Canary Release] -> [Telemetry Logs] |
|     -> [Integration Test] -> [Build]        |     -> [RUM Analytics] -> [AIOps]     |
+-----------------------------------------------------------------------------------+
Code language: PHP (php)
In traditional software workflows, testing finishes when code moves to production. Shift-Right shifts the focus to validating application behavior, infrastructure health, and end-user experience while the software runs in live environments.
This strategy relies on several key practices:
- Continuous Monitoring and Observability: Collecting metrics, logs, and traces to understand internal system health in real time.
- Production Validation: Conducting controlled experiments, canary releases, feature flag rollouts, and chaos testing in live settings.
- Real-User Monitoring (RUM): Analyzing actual client-side performance, latency, and navigation paths.
- Feedback-Driven Iteration: Routing operational data and user behavior insights directly back into development backlogs.
Consider an e-commerce platform launching a new payment microservice. Under traditional approaches, testing ends after unit and staging integration tests pass. Under a Shift-Right model, the team deploys the microservice behind a feature flag to 2% of live traffic, monitors database query latencies via real-time telemetry, tracks drop-off rates using real-user analytics, and automatically rolls back the release if error rates breach strict thresholds.
Shift-Right does not replace early quality checks; it completes the feedback loop by validating software where it matters most: in front of real users.
Understanding the Shift-Left vs. Shift-Right Approach
Modern DevOps teams combine early pre-production verification with post-deployment observation rather than treating them as competing philosophies.
| Functional Area | Shift-Left Approach | Shift-Right Approach |
| Primary Testing Focus | Code syntax, unit isolation, static security, integration logic | Live performance, resilience, chaos engineering, real-user validation |
| Lifecycle Timing | Pre-deployment (IDE, local builds, CI/CD pipeline runs) | Post-deployment (Production, staging, progressive rollouts) |
| Primary Team Ownership | Software Developers, QA Engineers, Security Analysts | SREs, DevOps Engineers, Platform Teams, Product Managers |
| Feedback Source | Automated test suites, synthetic mocks, simulated payloads | Real user traffic, distributed traces, live telemetry metrics |
| Risk Mitigation Strategy | Preventing bugs, vulnerabilities, and syntax errors early | Mitigating blast radius, recovering fast, verifying real-world resilience |
| Automation Mechanisms | CI pipelines, static analysis, unit test runners | Continuous deployment triggers, automated rollbacks, self-healing, AIOps |
Shift-Left ensures that code is functionally sound, secure, and structurally compliant before merging into main branches. It prevents simple logic bugs from reaching upstream environments.
However, Shift-Left cannot simulate millions of concurrent API calls, complex network partitions, or unexpected user behavior patterns.
Shift-Right complements early testing by verifying how systems behave under real-world conditions. Together, Shift-Left prevents known failure modes early, while Shift-Right identifies and mitigates unknown failure modes in live environments.
Why Shift-Right Matters in Modern DevOps
Software architecture has evolved from single-monolith deployments on local physical servers to distributed microservices running across global cloud infrastructures. This structural evolution makes post-deployment visibility essential for maintaining system stability.
                        [ Global Edge / CDN ]
                                  |
            +---------------------+---------------------+
            |                                           |
    [ Microservice A ]                         [ Microservice B ]
    (Kubernetes Cluster)                       (Serverless Functions)
            |                                           |
    +-------+-------+                           +-------+-------+
    |               |                           |               |
[DB Read]      [DB Write]                   [Third-Party API]  [Cache]
Code language: PHP (php)
Modern architectures introduce complex runtime dynamics that shift-right practices address:
- Distributed Complexity: Microservice topologies involve hundreds of independent network calls, asynchronous queues, and third-party APIs. Simulating these dynamic dependency paths in isolated staging environments is technically impractical.
- Unpredictable Production Traffic: Real users interact with applications in unscripted ways. They use varied network speeds, diverse client devices, and unexpected workflow sequences that synthetic test scripts rarely mirror.
- Ephemerality of Cloud Resources: Serverless instances, container auto-scaling, and spot nodes continuously spin up and terminate. Static pre-release testing cannot account for infrastructure state changes that happen at runtime.
- Blast Radius Minimization: Progressive delivery strategies—such as canary rollouts paired with automated metric checks—allow teams to test changes on a small fraction of traffic. This limits the impact if an issue occurs.
- Accelerated Delivery Speeds: High-performing engineering teams deploy code multiple times per day. Continuous post-deployment monitoring provides immediate visibility into every release without slowing down CI/CD pipelines.
Core Principles of Shift-Right in DevOps
A successful Shift-Right implementation relies on several key operational principles that turn raw production data into actionable engineering decisions.
| Core Principle | Operational Purpose | Key Business Benefit |
| Continuous Monitoring | Tracks infrastructure metrics, application health, and error trends continuously. | Prevents silent downtime and minimizes Mean Time to Detect (MTTD). |
| Production Testing | Executes validation safely on live systems using feature flags and canary deployments. | Reduces deployment risks while validating functionality under real conditions. |
| Real User Monitoring (RUM) | Captures client-side interaction times, rendering speeds, and regional latency. | Aligns technical performance metrics directly with customer experience goals. |
| Deep Observability | Correlates logs, metrics, and traces to expose root causes of complex failures. | Accelerates incident resolution and lowers Mean Time to Resolve (MTTR). |
| Incident Learning | Conducts blameless post-mortems to turn operational outages into systemic fixes. | Prevents recurring failures and strengthens infrastructure resilience. |
| Performance Tuning | Optimizes database queries, resource usage, and API throughput based on usage data. | Lowers cloud operational costs while improving application responsiveness. |
| Security Validation | Monitors live traffic for anomaly patterns, unauthorized access, and runtime threats. | Protects workloads against active exploits and compliance breaches. |
Principle 1: Continuous Monitoring After Deployment
Continuous monitoring involves tracking the health, resource utilization, operational availability, and performance trends of live applications and their underlying infrastructure. Rather than relying on periodic manual checks, automated systems gather metrics continuously to signal system degradation before users notice.
Continuous monitoring focuses on critical operational metrics known as the Four Golden Signals:
+-------------------------------------------------------------------+
|                       FOUR GOLDEN SIGNALS                         |
+-------------------+-------------------+-------------------+-------+
|      LATENCY      |      TRAFFIC      |      ERRORS       | SATURATION |
| Time taken to     | System demand     | Rate of failed    | Capacity   |
| process requests  | (e.g., HTTP reqs) | incoming requests | usage (%)  |
+-------------------+-------------------+-------------------+-------+
- Latency: Time required to process an incoming request (differentiating between successful and failed request response times).
- Traffic: Demand placed on the application, measured in HTTP requests per second, transaction volumes, or network I/O.
- Errors: Rate of incoming requests that fail, expressed explicitly (such as HTTP 5xx responses) or implicitly (such as returning wrong content with a 200 OK status).
- Saturation: System resource capacity usage, highlighting memory, CPU, disk I/O, or thread pool exhaustion.
Enterprise monitoring strategies rely on specialized tools designed for high-cardinality telemetry:
- Prometheus: An open-source, time-series metrics collector designed for scraping containerized endpoints.
- Grafana: A visualization engine that converts raw time-series data into actionable dashboards and operational alerts.
- Datadog & New Relic: SaaS observability platforms that unify infrastructure metrics, application traces, and log aggregation into single-pane dashboards.
YAML
# Example Prometheus Alerting Rule for High Error Rates
groups:
  - name: production_alerts
    rules:
      - alert: HighHTTPErrorRate
        expr: sum(rate(http_requests_total{status=~"5.."}[5m])) / sum(rate(http_requests_total[5m])) * 100 > 5
        for: 2m
        labels:
          severity: critical
        annotations:
          summary: "Production HTTP Error Rate Exceeds 5%"
          description: "Service {{ $labels.job }} error rate is at {{ $value }}% over the last 5 minutes."
Code language: PHP (php)
Principle 2: Observability and Production Insights
While traditional monitoring alerts teams when a system fails, observability provides the internal visibility needed to explain why it failed.
Observability relies on three primary data sources—often called the “Three Pillars of Observability”:
                      +-----------------------+
                      |  OBSERVABILITY TRINITY |
                      +-----------+-----------+
                                  |
        +-------------------------+-------------------------+
        |                         |                         |
   [ METRICS ]                [ LOGS ]                 [ TRACES ]
Numeric time-series     Structured timestamped       End-to-end request
aggregations over time  discrete event records      paths across services
- Metrics: Aggregated numeric time-series data measuring system health over set intervals (such as CPU usage or request rates).
- Logs: Structured, timestamped records of discrete events emitted by applications or systems (such as stack traces or authentication attempts).
- Traces: End-to-end journey maps tracking individual requests as they travel across distributed microservice architectures.
Distributed tracing helps engineers debug multi-tier architectures. When an API call fails or stalls, distributed tracing isolates the exact microservice, database query, or network call causing the bottleneck.
# Distributed Trace Visual Representation
[Client Gateway] -----------------------------------------> (Total: 450ms)
   |-- [Auth Service] ------> (20ms)
   |-- [Order Service] ------------------------------------> (420ms)
          |-- [Inventory API] --> (15ms)
          |-- [Payment Gateway] ---------------------------> (385ms) *LATENCY BOTTLENECK
Code language: PHP (php)
OpenTelemetry provides a vendor-neutral standard for generating, collecting, and exporting telemetry data. Using OpenTelemetry allows teams to instrument applications without locking themselves into specific vendor ecosystems.
Principle 3: Real User Monitoring (RUM)
Synthetic checks simulate user navigation paths from fixed test environments. However, Real User Monitoring (RUM) captures, analyzes, and reports on actual interactions from live browser sessions and mobile applications.
RUM gathers client-side performance metrics directly from user devices:
- Core Web Vitals: Largest Contentful Paint (LCP), Interaction to Next Paint (INP), and Cumulative Layout Shift (CLS).
- Network Context: Latency variations across geographic regions, cellular networks, and ISP routing paths.
- Client Environments: Rendering behavior across varying screen resolutions, hardware profiles, and web browser versions.
+-----------------------------------------------------------------------+
|                    REAL USER MONITORING DATA FLOW                     |
+-----------------------------------------------------------------------+
| [User Browser]  -- JavaScript Snippet -->  [RUM Ingestion API]        |
|  - Tracks Clicks                                  |                   |
|  - Measures LCP/INP                               v                   |
|  - Records Errors                          [Analytics Engine]         |
|                                                   |                   |
|                                                   v                   |
|                                       [Performance Dashboards]        |
+-----------------------------------------------------------------------+
For instance, an e-commerce platform might notice an increase in cart abandonment rates following a release. While server-side error logs remain clear, RUM analytics show that a JavaScript rendering bug is causing a 3-second input delay on mobile devices in specific regions. RUM bridges the gap between server-side infrastructure metrics and actual customer experience.
Principle 4: Production Testing
Production testing validates code logic, system performance, and infrastructure stability directly within live environments. Teams use guardrails like blast-radius limits and rapid rollback mechanisms to run these tests safely without risking downtime for real users.
Key techniques for safe production testing include:
                       CANARY DEPLOYMENT FLOW

                        [ Incoming Traffic ]
                                 |
                     +-----------+-----------+
                     |                       |
                 (95% Traffic)           (5% Traffic)
                     |                       |
                     v                       v
             [ Stable Version ]      [ Canary Version ]
                     |                       |
                     +-----------+-----------+
                                 |
                       [ Real-Time Metrics ]
                       - Error Rate < 0.1%?
                       - Latency Normal?
                                 |
                 +---------------+---------------+
                 |                               |
              (Pass)                          (Fail)
                 |                               |
                 v                               v
         [ Full Rollout ]              [ Automatic Rollback ]
Code language: JavaScript (javascript)- Canary Releases: Deploying new software versions to a small subset of infrastructure (e.g., 5% of traffic) alongside the stable production version. Automated monitoring checks error rates before expanding the rollout.
- Blue-Green Deployments: Maintaining two identical production environments (Blue for live traffic, Green for new releases). Switching router configurations instantly redirects traffic, enabling simple zero-downtime cutovers and rollbacks.
- Feature Flags: Wrapping new code paths inside conditional toggles managed by platforms like LaunchDarkly or Unleash. Teams can enable features for specific user segments, run beta evaluations, or instantly disable problematic code without redeploying.
- A/B Testing: Routing traffic to variant application experiences to measure performance against business metrics like user engagement or conversion rates.
- Chaos Engineering: Injecting controlled faults—such as network delays, server terminations, or packet loss—into live environments using tools like Gremlin or Chaos Mesh. This tests whether auto-healing architectures respond as expected during real outages.
Principle 5: Continuous Feedback Loops
Shift-Right principles rely on short, automated feedback loops that turn live operational data into actionable engineering tasks.
+-----------------------------------------------------------------------+
|                     CONTINUOUS FEEDBACK PIPELINE                      |
+-----------------------------------------------------------------------+
|  [ Live Production ] ---> [ Telemetry & User Insights ]              |
|                                   |                                   |
|                                   v                                   |
|  [ Code Adjustments ] <--- [ Prioritized Backlog ] <--- [ Post-Mortem]|
+-----------------------------------------------------------------------+
A structured feedback loop operates through four main phases:
- Telemetry & Insight Collection: Monitoring tools aggregate error logs, user feedback, and resource consumption trends.
- Analysis & Triage: Incident management systems automatically alert on-call teams or convert metric anomalies into engineering tasks.
- Blameless Post-Mortems: Engineering teams hold post-incident reviews to identify systemic root causes rather than assigning individual fault.
- Backlog Refinement: Actionable fixes, architectural refactoring, and automated guardrails are prioritized directly in upcoming sprint backlogs.
This continuous feedback loop turns everyday production incidents into long-term system reliability improvements.
Role of Automation in Shift-Right DevOps
Managing modern production environments manually is impractical due to scale, high traffic volumes, and distributed infrastructure architectures. Automation serves as the backbone of effective Shift-Right implementations.
Key areas where automation drives Shift-Right practices include:
- Automated Incident Response: Running pre-approved remediation scripts (runbooks) when known failure patterns occur—such as automatically clearing cached memory or restarting hung container pods.
- Self-Healing Systems: Configuring platform orchestrators to replace unhealthy instances, shift traffic around failing availability zones, and auto-scale infrastructure based on demand spikes.
- AIOps (Artificial Intelligence for IT Operations): Using machine learning algorithms to process massive volumes of operational data, suppress duplicate alert noise, group related symptoms, and detect unusual anomalies automatically.
+-------------------------------------------------------------------+
|                        AIOPS WORKFLOW ENGINE                      |
+-------------------------------------------------------------------+
| [Raw Event Streams] -> [Event Correlation] -> [Anomaly Detection] |
| (Logs/Metrics/Traces)  (Deduplicate Alerts)   (ML Baseline Match) |
|                                                       |           |
|                                                       v           |
| [Self-Healing Remediation] <-- [Automated Triggering]             |
| (Scale Up/Restart Pod)         (Invoke Lambda/Runbook)            |
+-------------------------------------------------------------------+
Code language: PHP (php)
Automating operational tasks reduces human error, speeds up incident response, and frees engineering teams to focus on core product delivery.
Shift-Right and Site Reliability Engineering (SRE)
Shift-Right engineering principles align closely with Site Reliability Engineering (SRE) practices. SRE applies software engineering discipline to operational challenges, using data-driven metrics to balance feature velocity with system stability.
+-----------------------------------------------------------------------+
|                    SRE RELIABILITY METRICS TIER                       |
+-----------------------------------------------------------------------+
| Service Level Indicator (SLI)   -->  Actual Measured Metric           |
|                                      (e.g., HTTP 200 Success = 99.8%) |
|                                                                       |
| Service Level Objective (SLO)   -->  Target Performance Threshold     |
|                                      (e.g., Target Availability = 99.5%)|
|                                                                       |
| Error Budget                    -->  Allowable Unreliability          |
|                                      (100% - SLO Target = 0.5%)       |
+-----------------------------------------------------------------------+
Code language: JavaScript (javascript)
Core SRE concepts that support Shift-Right objectives include:
- Service Level Indicators (SLIs): Carefully chosen metrics that quantify service performance in real time (e.g., success rates of checkout requests over a rolling 30-day window).
- Service Level Objectives (SLOs): Target reliability thresholds agreed upon by business and engineering stakeholders (e.g., maintaining 99.9% successful API requests).
- Error Budgets: The acceptable margin of unreliability calculated as
100% - SLO. If a service maintains a 99.9% SLO, its 0.1% error budget represents the allowable downtime for launching new features, running production experiments, or conducting canary tests. - Incident Management: Standardized operational frameworks for responding to, communicating during, and learning from production outages.
SRE teams rely heavily on Shift-Right telemetry to track SLIs continuously, manage error budgets dynamically, and maintain operational stability.
Shift-Right and DevSecOps
Shift-Left security (DevSecOps) focuses on static code analysis, vulnerability scanning, and container checks during development. Shift-Right DevSecOps extends security practices into production, addressing real-time threats and runtime vulnerabilities.
                       RUNTIME DEVSECOPS FRAMEWORK

                       [ Live Web Traffic Stream ]
                                    |
                        +-----------+-----------+
                        |                       |
             [ Threat Detection Engine ]  [ WAF / RASP Guard ]
                        |                       |
            (Anomalous Behavior Pattern)  (Active Exploit Block)
                        |                       |
                        +-----------+-----------+
                                    |
                         [ Automated Response ]
                         - Isolate Container
                         - Revoke JWT Tokens
                         - Trigger SOC Alert
Runtime security validation includes:
- Runtime Application Self-Protection (RASP): Security agents running inside application runtimes that detect and block attack vectors—such as SQL injections or cross-site scripting (XSS)—in real time.
- Behavioral Anomaly Detection: Tracking production traffic patterns using machine learning to identify unusual API access attempts, credential stuffing attacks, or data exfiltration.
- Compliance & Configuration Drift Auditing: Continuously checking production cloud environments to ensure security settings, IAM permissions, and network policies comply with organizational standards.
Combining Shift-Left security scans with Shift-Right runtime monitoring helps protect enterprise workloads against emerging attack vectors.
Kubernetes and Cloud-Native Shift-Right Practices
Containerized workloads running on platforms like Kubernetes require dedicated Shift-Right strategies due to their ephemeral, auto-scaling nature.
+-----------------------------------------------------------------------+
|                    KUBERNETES OBSERVABILITY STACK                      |
+-----------------------------------------------------------------------+
|  [ Kube-State-Metrics ]    [ Node Exporter ]      [ Fluentbit/Vector] |
|   (Cluster State Info)      (Hardware Health)      (Log Aggregation)  |
|            |                       |                       |          |
|            +-----------------------+-----------------------+          |
|                                    |                                  |
|                                    v                                  |
|                          [ Prometheus Engine ]                        |
|                                    |                                  |
|                                    v                                  |
|                         [ Alertmanager / Grafana ]                    |
+-----------------------------------------------------------------------+
Key Shift-Right practices in Kubernetes environments include:
- Container Health Probes: Configuring
liveness,readiness, andstartupprobes to let Kubernetes know when to route traffic to pods or restart stalled containers. - Resource Optimization: Analyzing live CPU and memory utilization patterns to set accurate container resource requests and limits, preventing resource starvation while trimming excess infrastructure costs.
- Cluster Observability: Using tools like
kube-state-metricsalongside Prometheus to track cluster health, deployment states, and ingress controller performance. - Service Mesh Visibility: Implementing platforms like Istio or Linkerd to collect service-to-service metrics, handle automated retries, enforce mutual TLS (mTLS), and manage canary traffic routing without modifying application code.
Real-World Shift-Right DevOps Workflow Example
The following scenario illustrates an enterprise Shift-Right workflow during a microservice deployment for an online travel booking engine.
[1. Developer Push] -> [2. CI/CD Build & Test] -> [3. Canary Deploy (5%)]
                                                           |
[6. Backlog Update] <- [5. Automated Rollback] <- [4. Metric Breach (Spike)]
Step 1: Progressive Code Deployment
An engineer updates the payment gateway integration and merges the code into the main branch. The CI/CD pipeline runs unit and integration tests (Shift-Left) before deploying the service container into the production Kubernetes cluster using a canary strategy.
Step 2: Automated Canary Verification
The deployment controller routes 5% of incoming live user traffic to the canary pod, leaving 95% on the stable version. Feature flags keep specific regional options disabled during initial rollout.
Step 3: Real-Time Telemetry & RUM Evaluation
Monitoring agents track real-time telemetry across both service versions:
- Stable Pods: HTTP 5xx error rate = 0.01%, Median Latency = 110ms.
- Canary Pods: HTTP 5xx error rate = 3.40%, Median Latency = 420ms.Real User Monitoring (RUM) agents flag client-side checkout timeouts on mobile browsers targeting the canary pod.
Step 4: Automated Remediation & Incident Triage
Prometheus triggers an automated alert indicating that the canary deployment violated the defined SLO threshold (Error Rate < 0.5%). The deployment controller automatically halts the rollout and routes 100% of traffic back to the stable release, neutralizing the incident within 45 seconds without manual intervention.
Step 5: Root Cause Analysis & Closed Loop Fix
Distributed traces expose an unhandled timeout on a third-party payment API under specific mobile headers. The engineering team reviews the incident logs, writes a unit test covering the edge case, updates the payment service code, and schedules the updated fix for the next release cycle.
Benefits of Shift-Right in DevOps
Adopting Shift-Right practices across software development and operational workflows delivers clear technical and business advantages:
- Higher System Availability: Detecting performance degradations and software bugs in live environments lowers Mean Time to Detect (MTTD) and Mean Time to Resolve (MTTR), keeping services available for users.
- Reduced Blast Radius: Progressive rollouts, canary releases, and feature flags ensure that software bugs affect only a small percentage of traffic before being caught and rolled back.
- Data-Driven Engineering Decisions: Engineering teams prioritize optimizations and architectural refactoring using real-world traffic data and actual system bottlenecks rather than assumptions.
- Faster Velocity with Safer Releases: Continuous visibility gives development teams the confidence to deploy features faster, knowing automated guardrails will protect production systems.
- Improved Alignment Between Business and Operations: Real-user performance data directly links technical metrics to conversion rates, user retention, and business growth.
Challenges of Implementing Shift-Right
While Shift-Right strategies offer clear benefits, organizations often face technical and operational hurdles during implementation.
+-------------------------------------------------------------------+
|               COMMON SHIFT-RIGHT CHALLENGES & SOLUTIONS           |
+-----------------------------------+-------------------------------+
| CHALLENGE                         | PRACTICAL SOLUTION            |
+-----------------------------------+-------------------------------+
| Alert Fatigue                     | Dynamic thresholds, AIOps     |
| High Telemetry Data Costs         | Log sampling, metric pruning  |
| Skill & Knowledge Gaps            | Structured SRE training paths |
| Culture Resistance                | Blameless post-mortem model   |
+-----------------------------------+-------------------------------+
- Alert Fatigue: Setting static alerts often creates noise, bombarding on-call engineers with false positives.
- Solution: Implement dynamic alerting thresholds based on historical trends and adopt AIOps tools to deduplicate correlated alerts.
- High Telemetry Storage Costs: Collecting logs, metrics, and traces across large microservice architectures can become expensive quickly.
- Solution: Use log sampling, aggregate metrics at the edge, and establish tier-based data retention policies.
- Skill and Knowledge Gaps: Moving from traditional IT monitoring to cloud-native observability requires specialized skills in distributed tracing, custom instrumentation, and SRE methodologies.
- Solution: Invest in structured training, hands-on labs, and industry-aligned certification programs.
- Cultural Resistance: Transitioning to production-level testing requires a culture comfortable with running controlled experiments in live environments.
- Solution: Start small using basic feature flags and canary deployments, proving safety before expanding advanced testing techniques.
Best Practices for Implementing Shift-Right
To build a reliable Shift-Right operational strategy, engineering teams should implement these core best practices:
- Establish Full Observability First: Deploy structured logging, metric collection, and distributed tracing before testing in production environments.
- Use Progressive Delivery Guardrails: Pair every deployment pipeline with feature flag toggles, canary routing, and automated rollback triggers.
- Define Actionable SLOs and SLIs: Focus monitoring efforts on metrics that directly reflect real-user experiences rather than tracking hardware capacity alone.
- Adopt Blameless Incident Post-Mortems: Treat production outages as learning opportunities to improve systemic resilience, update runbooks, and add automated tests.
- Automate Common Incident Response Tasks: Convert repetitive manual interventions into automated self-healing scripts and runbooks.
- Foster Cross-Team Collaboration: Encourage developers, SREs, QA engineers, and security teams to share responsibility for production reliability.
Tools Used for Shift-Right DevOps Practices
Building an enterprise Shift-Right platform requires a cohesive toolstack spanning monitoring, observability, feature management, and incident response.
| Category | Recommended Tools | Primary Operational Purpose |
| Metrics & Monitoring | Prometheus, Grafana, Datadog, Zabbix | Scrapes time-series metrics, builds system health dashboards, and evaluates alerts. |
| Log Aggregation | Elastic Stack (ELK), Fluentbit, Splunk, Loki | Centralizes, indexes, and searches application and infrastructure logs. |
| Distributed Tracing | Jaeger, Zipkin, OpenTelemetry, AWS X-Ray | Tracks request journeys across microservice boundaries to highlight latency bottlenecks. |
| Feature Management | LaunchDarkly, Unleash, Flagsmith | Controls feature releases using remote conditional toggles without redeploying code. |
| Production Testing | Gremlin, Chaos Mesh, LitmusChaos, K6 | Executes chaos experiments, load generation, and fault injection tests in live settings. |
| Incident Management | PagerDuty, Opsgenie, VictorOps | Manages on-call schedules, routes incident alerts, and coordinates emergency responses. |
| Security Monitoring | Falcon (CrowdStrike), Sysdig, Aqua Security | Monitors runtime container behavior, identifies threats, and enforces security policies. |
Industries Using Shift-Right Practices
Organizations across diverse sectors use Shift-Right strategies to protect revenue, maintain system availability, and deliver reliable digital services.
Banking & Financial Services
Financial platforms run high-volume, low-latency transaction processing systems. Shift-Right observability continuously tracks API responses, detects fraud patterns, and verifies compliance controls across live transaction streams without interrupting customer services.
Healthcare & Life Sciences
Modern healthcare systems handle critical patient data across complex integrations. Shift-Right runtime security and compliance monitoring keep telemetry systems secure, ensure high availability for core EHR services, and minimize unexpected outages.
E-Commerce & Retail
E-commerce platforms experience volatile traffic shifts during sales events. Real User Monitoring (RUM) tracks client-side rendering speeds, while canary releases allow teams to deploy new cart workflows safely during peak shopping hours.
SaaS & Enterprise Cloud Platforms
Multi-tenant software providers run continuous feature updates across shared infrastructure. Feature flag management and canary deployments enable SaaS engineering teams to roll out updates smoothly to specific customer tiers without global disruptions.
Telecommunications & Media Streaming
Media platforms deliver content to millions of concurrent streams globally. Chaos engineering and continuous monitoring help engineering teams test network redundancy, optimize CDN routing, and deliver uninterrupted streaming during high-traffic events.
Career Opportunities Related to Shift-Right DevOps
As organizations transition to cloud-native architectures, demand continues to grow for professionals skilled in production observability, resilience engineering, and automated monitoring.
                  SHIFT-RIGHT CAREER PATHWAYS

            +------------------------------------+
            |      DevOps / SRE Specialist       |
            +-----------------+------------------+
                              |
     +------------------------+------------------------+
     |                        |                        |
[ Observability Engine ]  [ Platform Architect ]  [ DevSecOps Specialist ]
(Metrics/Tracing/Logs)   (Developer Pipelines)    (Runtime Security)
Target operational roles include:
- Site Reliability Engineer (SRE): Focuses on system availability, latency optimization, incident management, and error budget administration.
- DevOps Engineer: Designs CI/CD automation pipelines, progressive delivery workflows, and infrastructure monitoring stacks.
- Observability Engineer: Specializes in designing scalable telemetry pipelines, OpenTelemetry instrumentation, and distributed tracing platforms.
- Platform Engineer: Builds internal developer platforms (IDPs) featuring integrated feature flag tools, automated deployment guardrails, and telemetry templates.
- DevSecOps Engineer: Integrates security checks into deployment pipelines and manages runtime threat detection platforms.
Key skills for these career paths include hands-on experience with Kubernetes, Prometheus, Grafana, OpenTelemetry standards, infrastructure-as-code platforms, and scripting languages like Python or Go.
Certifications & Learning Paths
Building a career in modern DevOps and SRE requires structured, hands-on training that mirrors real-world production environments. Platforms like DevOpsSchool offer dedicated training paths designed to help engineers master cloud-native toolstacks, observability practices, and production workflows.
| Certification / Path | Target Professional | Level | Strategic Focus Area |
| Certified DevOps Engineer (CDE) | DevOps Engineers, System Admins | Associate to Advanced | End-to-end CI/CD, automation workflows, and production monitoring principles. |
| Site Reliability Engineering (SRE) Master | SREs, Systems Engineers | Advanced | Managing SLIs/SLOs, handling error budgets, chaos engineering, and incident response. |
| Certified Kubernetes Administrator (CKA) | Cloud Engineers, Platform Teams | Intermediate | Cluster management, pod networking, container health probes, and cluster troubleshooting. |
| Prometheus & Grafana Certified Associate | Observability Specialists, SREs | Intermediate | Collecting time-series metrics, designing alerting rules, and building operational dashboards. |
Common Beginner Mistakes
When adopting Shift-Right methodologies, engineering teams often fall into predictable traps. Avoid these common missteps:
- Neglecting Shift-Left Foundations: Skipping static analysis or unit testing under the assumption that production monitoring will catch all issues.
- Over-Alerting Without Actionable Context: Configuring alerts for non-critical metric spikes, leading to alert fatigue and delayed incident responses.
- Ignoring Client-Side User Experience: Relying exclusively on server-side health checks while overlooking Real User Monitoring (RUM) and client-side rendering errors.
- Running Uncontrolled Production Tests: Executing live experiments without clear blast-radius boundaries, automated rollbacks, or feature flag controls.
- Collecting Telemetry Without Goal Alignment: Ingesting massive log volumes without defining clear SLIs, SLOs, or retention schedules.
- Treating Outages as Individual Failures: Blaming team members during incidents instead of conducting blameless post-mortems focused on systemic fixes.
Future Trends in Shift-Right DevOps
As software delivery models continue to evolve, emerging trends are reshaping how engineering teams observe, manage, and optimize live systems:
- Autonomous Remediation & Self-Healing: Systems are increasingly moving beyond passive alert notifications toward fully automated self-healing workflows powered by AI-driven runbooks.
- Predictive Telemetry via AIOps: Machine learning models are transitioning from static threshold alerting to predictive anomaly detection, catching failure trends before service disruptions occur.
- Unified OpenTelemetry Standards: OpenTelemetry is becoming the universal standard across telemetry collectors, eliminating vendor lock-in for logs, metrics, and traces.
- Security & Observability Convergence (DevSecOps): Security telemetry is merging directly with operational observability, enabling real-time threat detection within standard performance dashboards.
- Cost Observability (FinOps Integration): Real-time cloud infrastructure cost metrics are being integrated directly into deployment dashboards, helping teams balance performance needs with cloud spending.
Frequently Asked Questions (FAQs)
1. What is Shift-Right in DevOps?
Shift-Right in DevOps is the practice of extending testing, monitoring, quality validation, and user feedback collection into live production environments. It focuses on observing real-world software behavior after deployment.
2. Why is Shift-Right important for modern software delivery?
Pre-production staging environments cannot fully replicate complex microservice dependencies, live user traffic variations, or cloud network conditions. Shift-Right provides the operational visibility needed to maintain system reliability under real-world conditions.
3. What is the difference between Shift-Left and Shift-Right?
Shift-Left focuses on pre-deployment validation—such as static code analysis, unit testing, and vulnerability scanning—to catch bugs early. Shift-Right focuses on post-deployment observation—including continuous telemetry, canary releases, and real-user monitoring—to manage live system reliability.
4. Does Shift-Right replace Shift-Left testing?
No. Shift-Left and Shift-Right complement each other. Shift-Left prevents known bugs and code defects from reaching production, while Shift-Right identifies unpredictable failure modes and optimizes application performance under live user traffic.
5. Is testing in production safe?
Yes, when executed with appropriate guardrails. Techniques like canary rollouts, blue-green deployments, feature flags, and automated rollback triggers allow teams to isolate testing to a small percentage of traffic without risking global system downtime.
6. What role does observability play in Shift-Right practices?
Observability provides the telemetry data—metrics, logs, and distributed traces—needed to understand an application’s internal state. It helps engineering teams identify the root causes of complex, cross-system failures in production.
7. What is Real User Monitoring (RUM)?
Real User Monitoring (RUM) is a telemetry practice that captures and analyzes actual client-side user interactions—such as page load speeds, input latency, and browser errors—directly from live user sessions.
8. How does feature flag management support Shift-Right DevOps?
Feature flags allow engineering teams to turn specific code paths on or off remotely without redeploying code. This enables targeted beta testing, canary rollouts, and instant feature rollbacks if operational metrics degrade.
9. What is Chaos Engineering, and how does it fit into Shift-Right?
Chaos Engineering is the practice of injecting controlled failure modes—such as network delays or service outages—into production systems to test whether auto-healing features and fallback mechanics perform as expected.
10. How do Site Reliability Engineering (SRE) and Shift-Right align?
Both disciplines focus on data-driven production reliability. SREs use Shift-Right telemetry to track Service Level Indicators (SLIs), enforce Service Level Objectives (SLOs), manage error budgets, and run blameless post-mortems.
11. What tools are commonly used for Shift-Right DevOps?
Popular Shift-Right tools include Prometheus and Grafana for metrics, the Elastic Stack (ELK) and Loki for logging, Jaeger and OpenTelemetry for tracing, LaunchDarkly for feature toggling, and PagerDuty for incident alerting.
12. How does Shift-Right support DevSecOps?
Shift-Right DevSecOps introduces runtime application self-protection (RASP), behavioral anomaly monitoring, and continuous cloud security auditing to detect and block security threats targeting live workloads.
13. What is alert fatigue, and how can teams prevent it?
Alert fatigue occurs when on-call teams are overwhelmed by frequent non-critical or false alerts. It can be minimized by adopting dynamic thresholds, grouping related notifications, and using AIOps engines to correlate root-cause alerts.
14. What are the key business benefits of adopting Shift-Right practices?
Shift-Right practices shorten Mean Time to Resolve (MTTR) incidents, limit outage impacts, improve customer satisfaction through faster feature delivery, and align technical performance directly with business outcomes.
15. How can engineers start learning Shift-Right DevOps strategies?
Engineers can build foundational skills by gaining hands-on experience with cloud-native monitoring stacks (Prometheus, Grafana), distributed tracing concepts, Kubernetes cluster administration, and structured SRE training programs available through platforms like DevOpsSchool.
Final Thoughts
Shift-Right in DevOps represents a fundamental mindset shift in how modern software delivery teams manage application health. Deploying code to production is no longer the final step in a development pipeline; it is the beginning of a continuous feedback loop that drives ongoing reliability, performance, and user experience improvements.
By combining Shift-Left quality checks with Shift-Right observability, canary testing, and progressive delivery guardrails, engineering teams build systems that are resilient by design. Embracing continuous production learning helps organizations minimize downtime, recover quickly from incidents, and deliver features that meet real user needs.

Find Trusted Cardiac Hospitals
Compare heart hospitals by city and services — all in one place.
Explore Hospitals
Shift-Right becomes truly valuable when teams focus not just on collecting more production data, but on converting that data into reliable engineering decisions. In large systems, the challenge is often not a lack of telemetry but managing the quality of signals — reducing alert fatigue, defining meaningful SLOs, and connecting user-impact metrics with infrastructure behavior. Teams also need clear ownership models for production feedback so incidents, performance issues, and user insights are translated into actionable improvements rather than remaining isolated in monitoring dashboards. Another important consideration is balancing experimentation with customer safety through automated guardrails, error budgets, and progressive delivery practices. The maturity of Shift-Right will depend on how effectively organizations transform real-world production behavior into continuous architectural improvements, not simply how much data they collect.