
Introduction
In the current landscape of distributed cloud-native systems, reliability is not merely a feature—it is the foundation of the user experience. As systems grow in complexity, moving from monolithic architectures to microservices and Kubernetes, the challenge of maintaining uptime becomes exponentially harder. A service that seems stable on the surface may be masking critical failures in background processing, database locking, or network congestion. This is why Site Reliability Engineering (SRE) teams rely heavily on metrics.
When systems fail, the difference between a minor blip and a total outage often comes down to how effectively the team monitored the right data points before the incident occurred. Without clearly defined SRE metrics, engineering teams are essentially flying blind, reacting to incidents rather than preventing them.
At SRESchool, we emphasize that measurement is the prerequisite for improvement. If you cannot measure the health of a system, you cannot manage its reliability. This article serves as a comprehensive guide for SREs, DevOps engineers, and cloud architects to understand, implement, and master the metrics that truly matter. Whether you are troubleshooting a sudden spike in latency or planning for capacity, the principles outlined here will provide the operational framework needed to maintain high-performing systems.
What Are SRE Metrics?
SRE metrics are quantifiable data points used to assess the health, performance, and reliability of a production system. Unlike traditional system administration metrics that might only track if a server is “up” or “down,” SRE metrics provide a holistic view of the user experience and the internal state of the service.
Monitoring vs. Observability is a common distinction here. Monitoring tells you that something is wrong. Observability tells you why it is wrong by allowing you to inspect the system’s internal state based on its external outputs. SRE metrics act as the bridge between raw data and actionable insight. They transform noisy, high-cardinality data into meaningful signals that dictate whether a service is meeting its reliability goals.
Why SRE Metrics Matter for Reliable Systems
Without metrics, engineering teams resort to guesswork. A senior engineer might look at a server, see 50% CPU usage, and assume everything is fine. However, if the database is deadlocking due to bad query patterns, the system is failing its users despite the healthy CPU stats. SRE metrics matter because they provide:
- Early Problem Detection: Identifying anomalies (like a slow memory leak) before they trigger a customer-facing outage.
- Incident Response Clarity: Reducing the time spent in war rooms by pointing directly to the subsystem that is misbehaving.
- Capacity Planning: Understanding growth trends to ensure infrastructure scales before reaching saturation points.
- Business Alignment: Linking technical performance (e.g., latency) to business outcomes (e.g., conversion rates).
Understanding the Foundation: SLI, SLO, and SLA
Reliability starts with defining what “good” looks like. We use three specific acronyms to set these expectations.
| Term | Meaning | Purpose | Example |
| SLI | Service Level Indicator | A specific measurement of service performance. | Percentage of successful HTTP requests. |
| SLO | Service Level Objective | The target value for the SLI. | 99.9% of requests will succeed over 30 days. |
| SLA | Service Level Agreement | The business contract regarding service reliability. | Contractual promise of 99.9% uptime with penalties. |
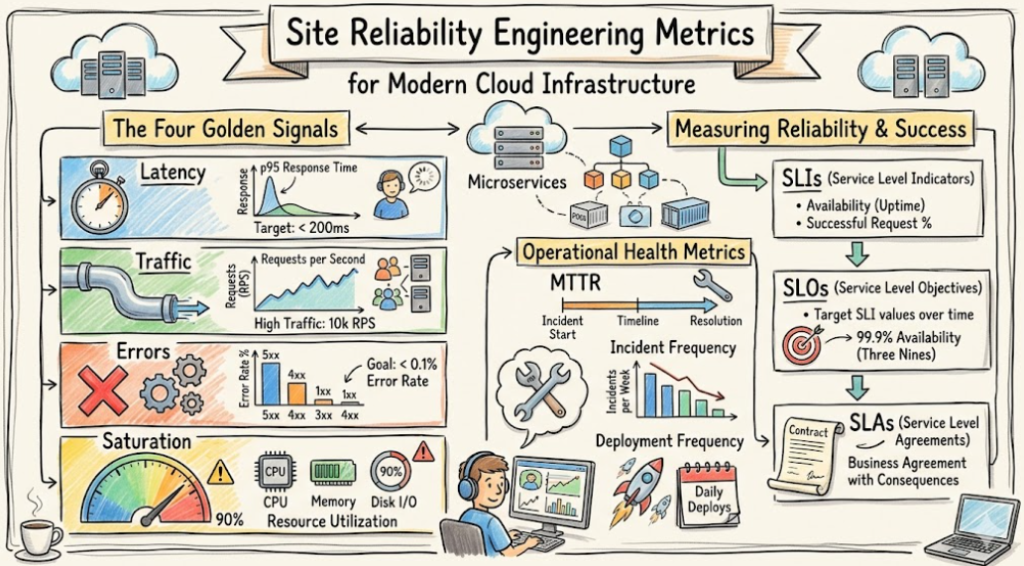
These definitions create a clear hierarchy. You track SLIs, aim for SLOs, and honor SLAs.
The Four Golden Signals in SRE
Google popularized the “Four Golden Signals” as the baseline for monitoring any distributed system. If you monitor nothing else, start here.
| Metric | What It Measures | Why It Matters |
| Latency | Time taken to service a request. | High latency equals a poor user experience. |
| Traffic | Demand placed on the system (RPS). | Helps in planning capacity and scaling. |
| Errors | Rate of requests that fail. | Indicates code or infrastructure bugs. |
| Saturation | How “full” the service is. | Predicts future bottlenecks. |
Metric 1: Availability and Uptime
Availability is the percentage of time a service is functioning as intended. It is typically expressed in “nines.”
- 99.9% (Three Nines): Allows for roughly 43 minutes of downtime per month.
- 99.99% (Four Nines): Allows for roughly 4 minutes of downtime per month.
Tracking availability requires robust load balancing and failover systems. If a primary database fails, does your system automatically switch to a standby? If not, your availability metrics will drop instantly.
Metric 2: Latency
Latency is the measure of time it takes for a request to return a response. We rarely look at averages because averages hide the truth. An average response time of 100ms might mean 50% of users are getting sub-50ms responses, while the other 50% are waiting 150ms.
Instead, we use percentiles:
- P50 (Median): The speed at which half your users experience the system.
- P95: The speed for 95% of users. This is usually the target for performance.
- P99: The speed for the slowest 1% of users. This captures the “tail latency” that affects your most frustrated customers.
Metric 3: Error Rate
Error rate is the proportion of requests that fail. In web services, this is typically categorized by HTTP status codes.
- 5xx Errors: These are critical. They indicate the server failed to process the request (e.g., database connection error, null pointer exception).
- 4xx Errors: These usually indicate client-side issues (e.g., bad request, unauthorized access).
High 5xx error rates are the first indicator of a deployment gone wrong. Always monitor the rate of change in error codes, not just the absolute number.
Metric 4: Throughput and Traffic
Throughput measures the amount of work a system is doing, typically calculated as Requests Per Second (RPS) or Queries Per Second (QPS). Traffic metrics are essential for autoscaling. If you track your baseline traffic, you can automate your cluster to scale out before the spike hits, rather than trying to catch up after the system is already saturated.
Metric 5: Saturation
Saturation measures how much of your resource capacity is currently in use. Think of this as the “stress level” of your infrastructure.
- CPU Usage: High CPU often indicates inefficient code or heavy background processing.
- Memory: If memory utilization approaches 100%, you risk OOM (Out of Memory) kills, causing container restarts.
- Disk I/O: Critical for database performance.
- Network: Bandwidth saturation can cause packet drops.
Metric 6: Mean Time to Detection (MTTD)
MTTD measures how long it takes from the start of an incident until the team is alerted. A high MTTD usually means your monitoring and alerting systems are not sensitive enough or are tuned incorrectly. If a customer reports an issue before your alert triggers, your MTTD is poor.
Metric 7: Mean Time to Recovery (MTTR)
MTTR is the average time taken to resolve an incident after it has been detected. This metric focuses on the efficiency of your incident response process, the quality of your runbooks, and the speed of your automated recovery scripts.
Metric 8: Change Failure Rate
This measures the percentage of deployments or infrastructure changes that result in a service failure. If your Change Failure Rate is high, it is a signal that your CI/CD pipeline lacks proper automated testing, canary deployments, or rollback capabilities.
Metric 9: Deployment Frequency
While not a direct “reliability” metric, it is a proxy for engineering maturity. Teams that deploy small, frequent changes generally have fewer incidents because the blast radius of any single change is smaller. It is easier to debug one small commit than a massive monolithic release.
Metric 10: Incident Volume and Severity
Tracking the total number of incidents over time (e.g., SEV1, SEV2, SEV3) helps you identify patterns. Are incidents concentrated around a specific service? Are they happening during specific times of the day? This data feeds directly into your post-mortem process.
Metric 11: Capacity and Infrastructure Metrics
Beyond service health, keep an eye on the platform layer.
- Kubernetes Pod Restarts: Frequent restarts suggest instability.
- Node Health: Are instances becoming unresponsive?
- Storage Throughput: Are your volumes hitting IOPS limits?
Metric 12: Database Performance Metrics
The database is frequently the bottleneck of modern applications. Monitor:
- Query Latency: Are specific queries slowing down over time?
- Connection Pool Usage: Are you running out of database connections?
- Replication Lag: Is the read replica falling behind the primary?
Metric 13: Security and Reliability Metrics
Security events are reliability events.
- Failed Login Attempts: Spikes can indicate a brute-force attack.
- Unusual Traffic Patterns: May indicate a DDoS attempt.
- Compliance Monitoring: Ensure your infrastructure remains in a hardened state.
Real-World SRE Monitoring Workflow Example
To put this into practice, consider a standard production incident workflow:
- Metric Collection: Prometheus scrapes metrics every 15 seconds from your Kubernetes cluster.
- Dashboarding: Grafana displays the P99 latency. A spike triggers an alert.
- Alerting: An alert is sent to Slack or PagerDuty.
- Discovery: The SRE opens the dashboard, sees that latency correlates with a spike in 5xx errors.
- Investigation: The SRE checks logs (ELK Stack) and traces (Jaeger) to find the specific microservice throwing the error.
- Recovery: The SRE rolls back the latest deployment or scales the resource.
- Postmortem: After the service recovers, the team reviews the metrics to calculate MTTD and MTTR and writes a blameless post-mortem.
Popular Tools for Tracking SRE Metrics
| Tool | Best For | Complexity | Enterprise Usage |
| Prometheus | Metric collection & alerting | Medium | High |
| Grafana | Visualization & Dashboards | Low | High |
| Datadog | Unified monitoring & observability | Low | Very High |
| ELK Stack | Log aggregation | High | High |
| New Relic | APM & Full-stack observability | Low | High |
| Splunk | Large-scale log analysis | High | Very High |
Common Mistakes SRE Teams Make
- Monitoring Everything: You cannot monitor every single variable. Focus on user-facing symptoms first (the golden signals).
- Weak Alerting: If your alerts are noisy (alert fatigue), people will ignore them. Alert on symptoms, not on causes.
- Ignoring SLOs: If you do not have SLOs, you do not know if you are being “reliable enough.”
- Lack of Context: A spike in error rates means nothing if you do not know which deployment caused it. Use version tagging.
Best Practices for SRE Metrics Tracking
- Adopt SLO-Driven Monitoring: Your alert thresholds should align with your SLOs.
- Automate Alerting: Avoid manual alert creation; use “Alerts as Code” (e.g., Prometheus rules stored in Git).
- Focus on Symptoms: Alert when the user experience degrades, not when a single background task fails.
- Regular Reviews: Metrics are not “set and forget.” Review your dashboards and alert definitions during quarterly planning.
Role of Observability in SRE Metrics
Observability is the superset of monitoring. While metrics tell you the “what” (e.g., “The site is slow”), logs tell you the “details” (e.g., “The payment gateway timed out”), and traces tell you the “journey” (e.g., “The request started at the frontend, went to service A, then to service B, and hung at the database”). An effective SRE setup uses all three to perform root cause analysis.
Industries Benefiting from SRE Metrics
- Banking & Finance: Low latency and high availability are non-negotiable for transaction integrity.
- Healthcare: Reliability is a matter of patient safety; monitoring ensures systems are available for life-critical services.
- E-Commerce: Every millisecond of latency correlates directly to revenue loss.
- SaaS Platforms: Maintaining high uptime is essential for customer trust and SLA compliance.
- Telecom: Managing traffic spikes during peak hours requires deep visibility into capacity.
Career Opportunities in SRE and Reliability Engineering
The demand for SREs has skyrocketed. Companies are moving away from manual operations to automated, code-driven reliability. Roles include:
- Site Reliability Engineer: Focuses on the production environment.
- Platform Engineer: Builds the infrastructure and tools for developers to self-service.
- Observability Engineer: Specializes in building the monitoring and tracing stack.
- Production Engineer: Ensures the software is built with reliability in mind.
Certifications & Learning Paths
Continuous learning is part of the SRE culture. Use structured programs to build your foundation.
| Certification | Best For | Skill Level | Focus Area |
| CKA | Kubernetes | Intermediate | Container Orchestration |
| AWS/GCP/Azure Architect | Cloud Infrastructure | Advanced | Cloud Native Design |
| SRE Foundation | Process & Theory | Beginner | SRE Principles |
| Observability Specialization | Monitoring Tools | Intermediate | Monitoring & Logging |
We recommend engaging with the SRESchool ecosystem to bridge the gap between theory and hands-on production engineering.
Common Beginner Mistakes
- Ignoring Linux Fundamentals: You cannot debug a system if you do not understand the operating system (e.g., kernel limits, file descriptors).
- Weak Networking Knowledge: Understanding TCP/IP, DNS, and load balancing is mandatory for SREs.
- Tool Obsession: Don’t just learn a tool (like Prometheus); learn the concepts (time-series data, exporters, query languages).
- Avoiding Incident Management: Participate in on-call rotations early. Experience is the best teacher.
- Not Building Projects: A personal project where you set up a monitoring stack is worth more than ten certifications.
Future of SRE Metrics
The field is moving toward Predictive Observability. Instead of reacting to a metric crossing a threshold, AI-driven models are being used to identify patterns that lead to failure. Platform engineering is also reducing the burden on SREs by providing “Golden Paths” that have monitoring, logging, and tracing pre-configured. Reliability is becoming a default setting rather than an afterthought.
FAQs
- What are SRE metrics?SRE metrics are quantitative measurements that assess the reliability, performance, and availability of production systems.
- What is the difference between SLI, SLO, and SLA?An SLI is a measurement (the ‘what’), an SLO is a target (the ‘goal’), and an SLA is a business contract (the ‘promise’).
- What are the four golden signals?Latency, Traffic, Errors, and Saturation.
- Why is MTTR important?It measures the efficiency of your incident response and recovery processes.
- What tools do SRE teams use?Common tools include Prometheus for metrics, Grafana for visualization, and various log aggregators.
- Is Kubernetes important for SRE?Yes, it is the standard for modern cloud infrastructure, and understanding it is critical for managing scale.
- What metrics matter most for uptime?Availability percentage and Error rates are the primary indicators of uptime.
- Is SRE a good career path?Yes, it combines software engineering with systems operations and offers high growth potential in the cloud sector.
- How do I start learning SRE?Focus on Linux fundamentals, networking, and cloud platforms. Explore resources like SRESchool for structured learning.
- What is the difference between monitoring and observability?Monitoring tells you when things go wrong; observability helps you understand why.
- How many nines do I need?It depends on your business requirements. Not every system needs 99.999% availability, which is expensive to maintain.
- Should I alert on every error?No. Alerting on every error causes fatigue. Alert on symptoms that impact the user.
- What is saturation?It refers to the utilization of resources (CPU, Memory, Disk, Network) and helps predict when a system will fail.
- How do I measure change failure rate?Track the number of deployments against the number of incidents that occur shortly after those deployments.
- Can I use AI for SRE metrics?Yes, AI can help with anomaly detection and predictive scaling, though it should augment, not replace, core SRE principles.
Final Thoughts
Reliability is a journey, not a destination. You do not achieve “perfect” reliability; you achieve a system that is robust enough to handle the inevitable failures of the cloud. The metrics we have discussed are the dashboard of your aircraft. They do not fly the plane for you, but they tell you when you are off course, when the engines are struggling, and when you are safely cruising.
Do not be intimidated by the number of metrics available. Start with the Four Golden Signals. Build one dashboard, create one meaningful alert, and iterate from there. The goal is to build a culture where decisions are made based on data, not hunches. Reliability engineering is about creating predictable systems, and metrics are the most honest feedback loop you have.

Find Trusted Cardiac Hospitals
Compare heart hospitals by city and services — all in one place.
Explore Hospitals