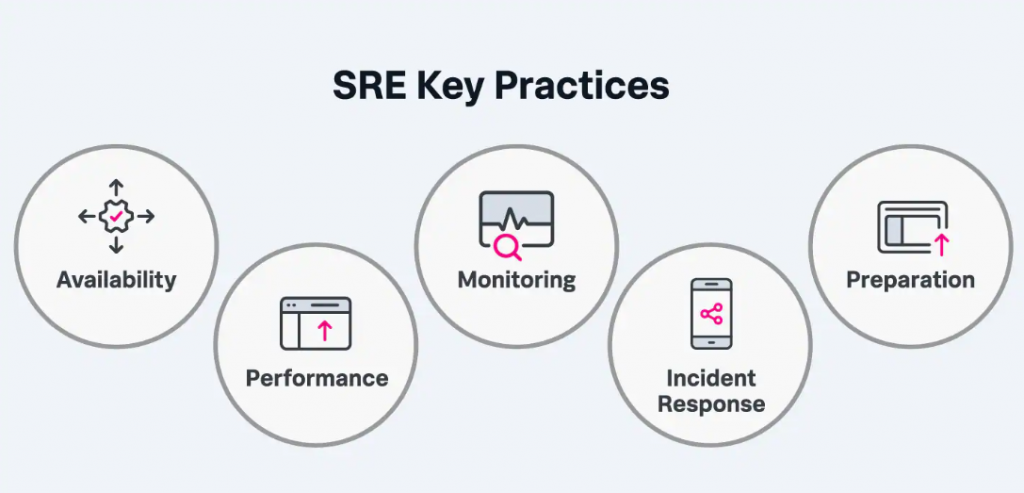
A site reliability engineer (SRE) creates a bridge between development and IT operations by taking on the tasks typically done by operations Team. And such tasks are given to these types of engineers who use automation tools to solve problems by creating scalable and reliable software systems. The main goal of SRE is to swiftly fix bugs and remove manual work in rote tasks. In another words, we can say Site reliability engineering (SRE) provides a unique approach to application lifecycle and service management by incorporating various aspects of software development into IT operations.
What is SRE Monitoring?
At the most basic level, monitoring allows you to gain visibility into a system, which is a core requirement for judging service health and diagnosing your service when things go wrong. General monitoring tools usually focus on a single application. Monitoring, by textbook definition, is the process of collecting, analyzing, and using information to track a program’s progress toward reaching its objectives and to guide management decisions. Monitoring focuses on watching specific metrics. Logging provides additional data but is typically viewed in isolation of a broader system context. SREs use APM and monitoring tools to capture, measure, and track reliability metrics across the environment. SRE is a functional way to apply software development solutions to IT operations problems. From IT monitoring to software delivery to incident response – site reliability engineers are focused on building and monitoring anything in production that improves service resiliency without harming development speed.
What is SRE Observability?
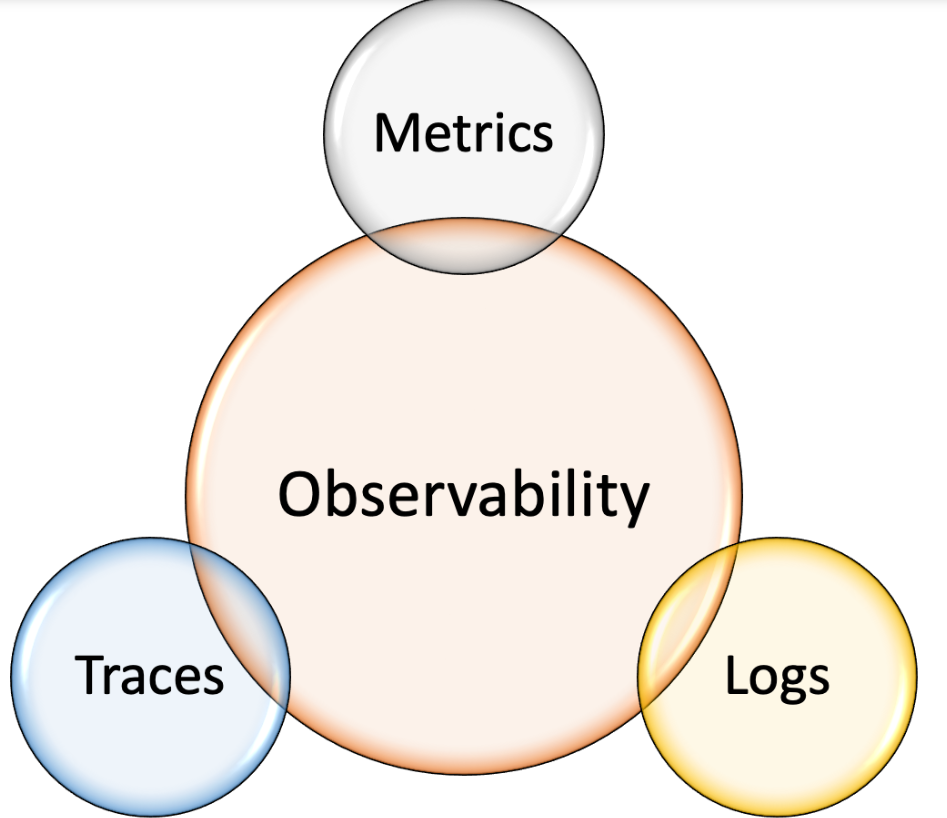
Observability is the ability to measure the internal states of a system by examining its outputs. A system is considered “observable” if the current state can be estimated by only using information from outputs, namely sensor data. Observability is the ability to understand a system’s internal state by analyzing the data it generates, such as logs, metrics, and traces. An observability tool is a software product that helps businesses receive continuous insights on the overall health of their deployed applications. The goal of observability is to understand what’s happening across all these environments and among the technologies, so we can detect and resolve issues to keep your systems efficient and reliable and your customers happy.
Difference between Monitoring and Observability?
Monitoring is capturing and displaying data, whereas observability can discern system health by analyzing its inputs and outputs. For example, we can actively watch a single metric for changes that indicate a problem-this is monitoring. A system is observable if it emits useful data about its internal state, which is crucial for determining root cause.
Top 10 Monitoring and observability tools in 2022 for SRE (Site reliability engineering)
- Datadog
- Splunk
- NewRelic
- Elastic
- Dynatrace
- Appdynamics
- prometheus
- Grafana
- Zabbix
- Nagios
Site24x7
Site24x7 is a comprehensive cloud-based monitoring platform developed by Zoho Corporation that helps businesses monitor the performance and availability of their entire IT infrastructure. It offers powerful capabilities across website monitoring, server monitoring, cloud infrastructure monitoring, application performance management (APM), network monitoring, and real user monitoring (RUM) — all from a single dashboard.
Designed for DevOps, IT administrators, and site reliability engineers (SREs), Site24x7 provides deep visibility, instant alerts, and advanced analytics to proactively detect issues, optimize performance, and ensure high availability across digital services.
Datadog
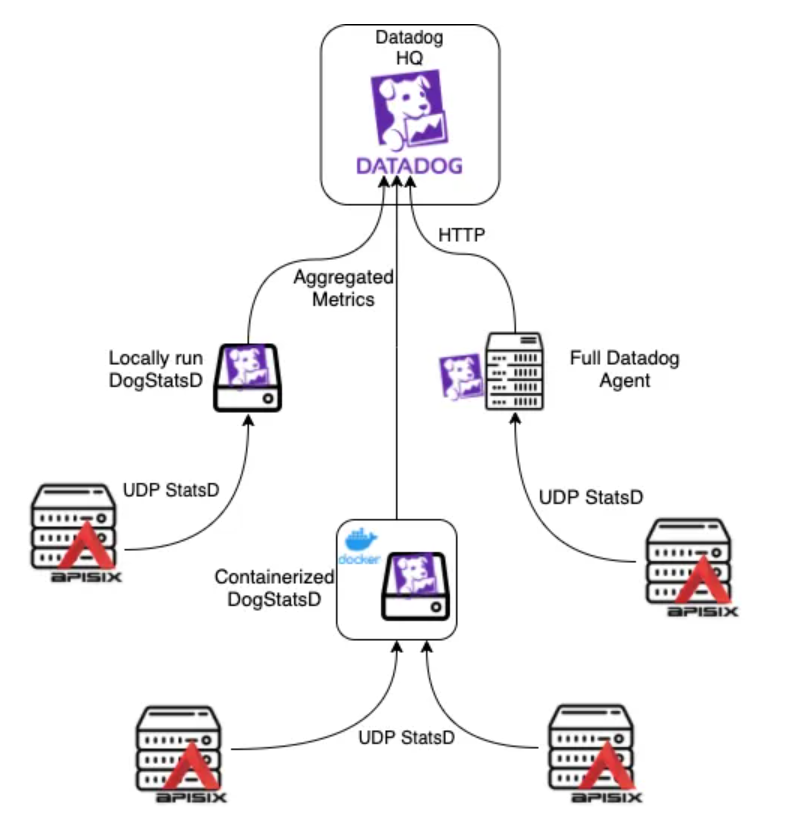
Datadog is a monitoring and analytics tool for information technology (IT) and DevOps teams that can be used to determine performance metrics as well as event monitoring for infrastructure and cloud services. The software can monitor services such as servers, databases and tools. The Datadog Agent is software that runs on your hosts. It collects events and metrics from hosts and sends them to Datadog, where you can analyze your monitoring and performance data. The Datadog Agent is open source and its source code is available on GitHub at DataDog/datadog-agent.
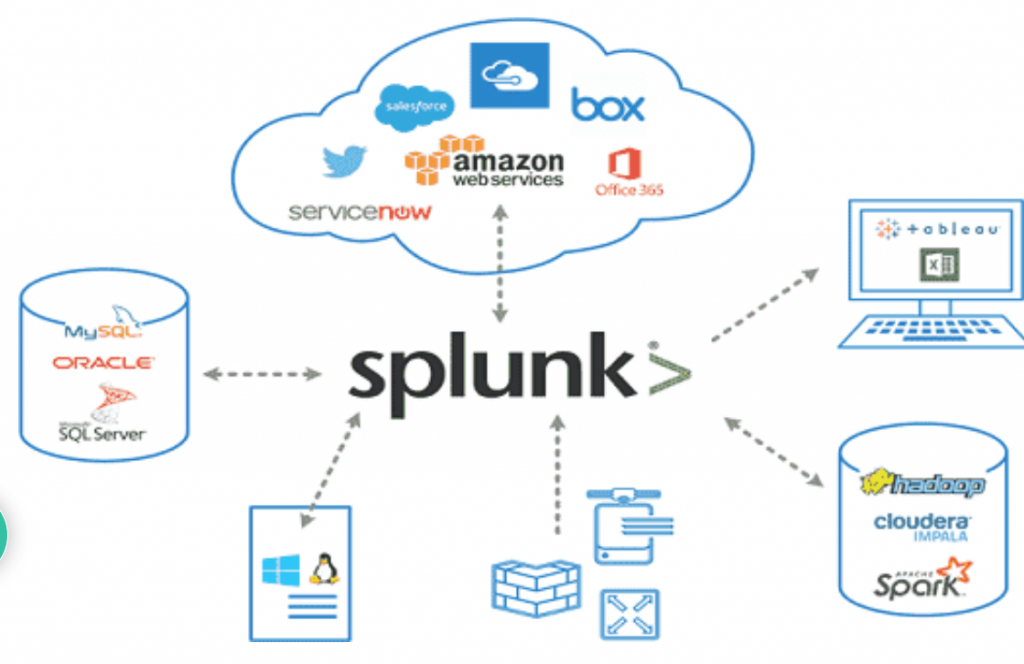
Splunk
Splunk is used for monitoring and searching through big data. It indexes and correlates information in a container that makes it searchable, and makes it possible to generate alerts, reports and visualizations. Splunk is an analytics-driven SIEM tool that collects, analyzes, and correlates high volumes of network and other machine data in real-time. This makes Splunk available on multiple platforms and can be installed speedily on any software. If one server is not enough another can be added easily and data is distributed across both these servers evenly.
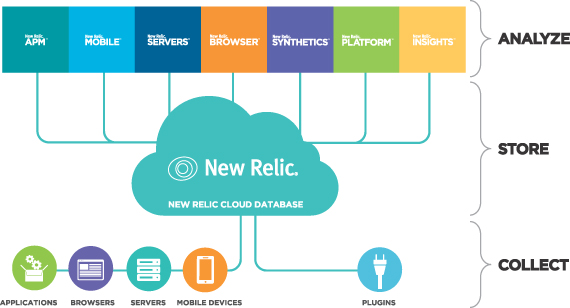
New Relic
New Relic is a Software as a Service offering that focuses on performance and availability monitoring. It uses a standardized Apdex (application performance index) score to set and rate application performance across the environment in a unified manner. New Relic is an observability platform that helps you build better software. You can bring in data from any digital source so that you can fully understand your system and how to improve it.
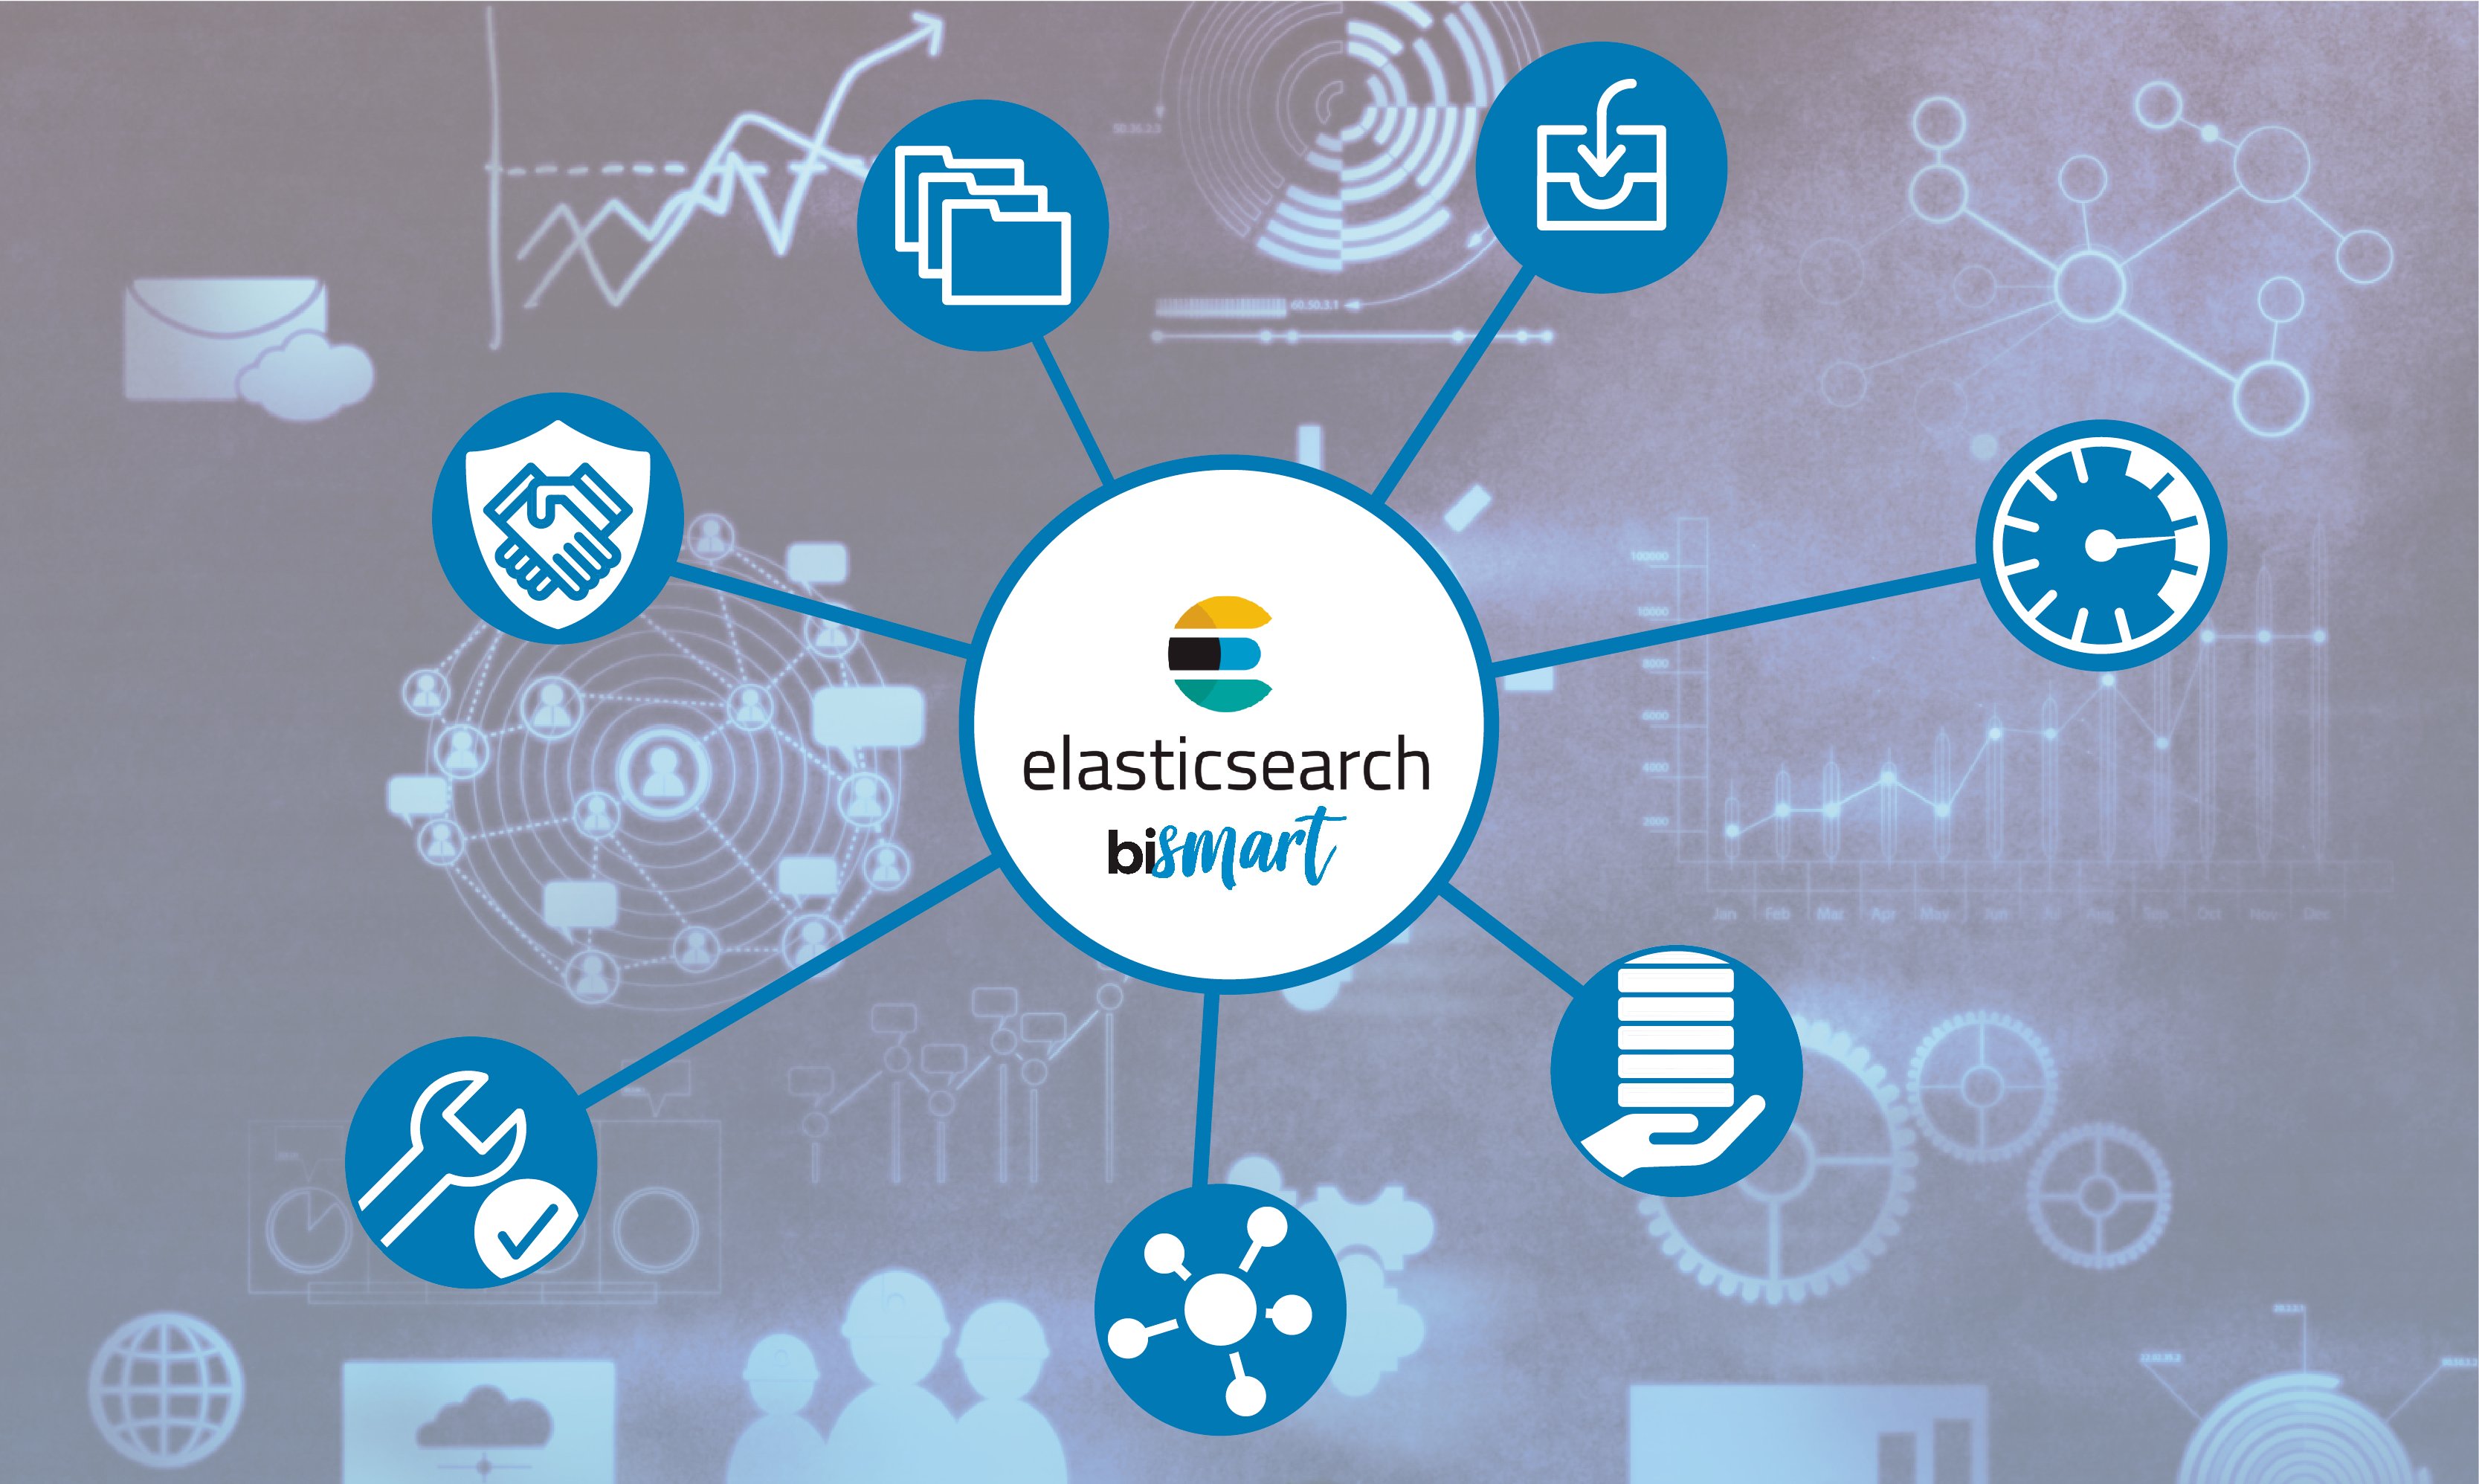
Elastic
Elasticsearch is a distributed search and analytics engine built on Apache Lucene. Since its release in 2010, Elasticsearch has quickly become the most popular search engine and is commonly used for log analytics, full-text search, security intelligence, business analytics, and operational intelligence use cases. Elasticsearch allows you to store, search, and analyze huge volumes of data quickly and in near real-time and give back answers in milliseconds. It’s able to achieve fast search responses because instead of searching the text directly, it searches an index.
Dynatrace
Dynatrace enables monitoring of your entire infrastructure including your hosts, processes, and network. You can perform log monitoring and view information such as the total traffic of your network, the CPU usage of your hosts, the response time of your processes, and more. Dynatrace consolidates monitoring tools into a single, easy to use platform. Cover your monitoring needs for application performance, digital experience, business analytics, AIOps, and infrastructure monitoring with Dynatrace: All-in-one, AI-powered, fully automated, enterprise grade.
Appdynamics
AppDynamics provides a significant amount of detail to solve performance problems by using APM Tools and an analytics-driven approach. The agents are extremely intelligent and know when to capture important details and when to simple collect the basics, and this is for every transaction. AppDynamics agents are plug-ins or extensions that monitor the performance of your application code, runtime, and behavior. They’re deployed to every corner of your application environment, from devices, to containers and hosts, to applications. The AppDynamics Business iQ tool helps build dashboards that automatically correlate application performance to business outcomes.

Prometheus
Prometheus can scrape metrics from jobs directly or, for short-lived jobs by using a push gateway when the job exits. The scraped samples are stored locally and rules are applied to the data to aggregate and generate new time series from existing data or generate alerts based on user-defined triggers. Prometheus is a monitoring solution for recording and processing any purely numeric time-series. It gathers, organizes, and stores metrics along with unique identifiers and timestamps. Prometheus is open-source software that collects metrics from targets by “scraping” metrics HTTP endpoints.

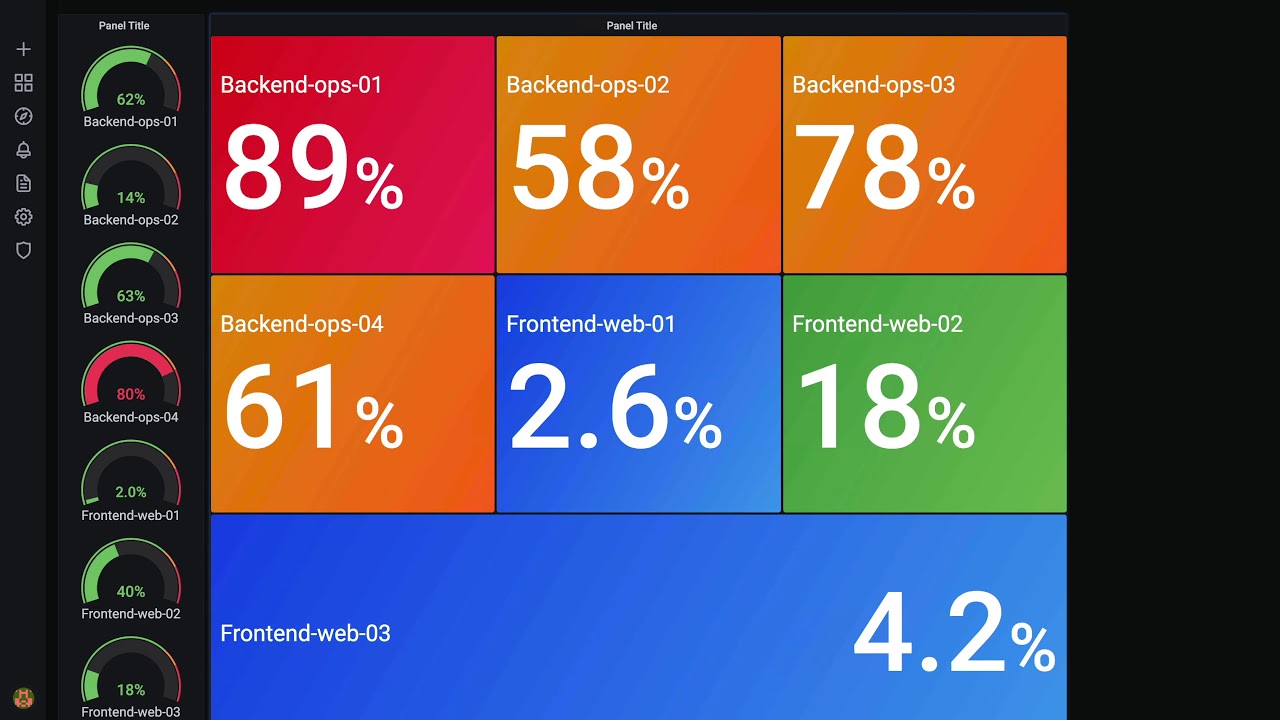
Grafana
Grafana is a free and open source (FOSS/OSS) visualization tool that can be used on top of a variety of different data stores but is most commonly used together with Graphite, InfluxDB, Prometheus, and Elasticsearch. Grafana is an open source solution for running data analytics, pulling up metrics that make sense of the massive amount of data & to monitor our apps with the help of cool customizable dashboards. Grafana offers plugins, dashboards, alerts, and different user-level access for governance as an observability tool. In addition, it provides two versions of services: Grafana cloud – You can send your data to Grafana cloud dashboards.
Zabbix
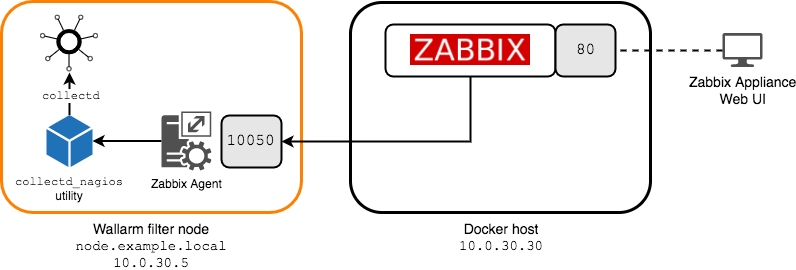
Zabbix is an open source monitoring software tool for diverse IT components, including networks, servers, virtual machines (VMs) and cloud services. Zabbix provides monitoring metrics, such as network utilization, CPU load and disk space consumption. By placing the monitoring server on an external network, the user can use Zabbix to monitor services like HTTP, SMTP, and SSH. Zabbix also monitors network access with monitoring items like the TCP service port, ICMP, and SNMP. It is also possible to confirm login and obtain content in accordance with user scenarios. Zabbix servers are very simple to deploy. You can run on a Windows box, Linux box or even in Docker containers. It’s very scalable and robust and doesn’t need too many resources to run. Due to its open framework, you can easily integrate Zabbix to other front end platforms, like Grafana.
Nagios
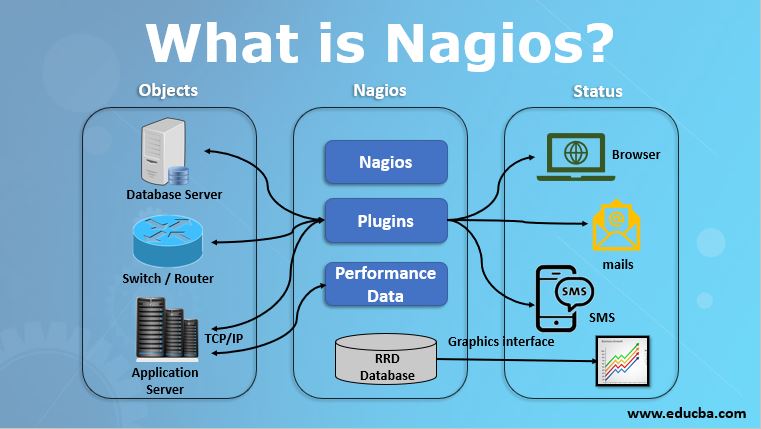
Nagios is an open source monitoring system for computer systems. It was designed to run on the Linux operating system and can monitor devices running Linux, Windows and Unix operating systems (OSes). Nagios software runs periodic checks on critical parameters of application, network and server resources. Nagios provides tools for monitoring of applications and application state – including Windows applications, Linux applications, UNIX applications, and Web applications. More Info: Application Monitoring Tools. Web Application Monitoring. Nagios XI is free for up to 7 nodes after the trial, so it’s a great resource to spin up and explore how easy it can be used to accommodate your enterprise needs. If you have any technical questions, be sure to check out our amazing support forums and technical resources.
MotoShare.in is your go-to platform for adventure and exploration. Rent premium bikes for epic journeys or simple scooters for your daily errands—all with the MotoShare.in advantage of affordability and ease.
Find Trusted Cardiac Hospitals
Compare heart hospitals by city and services — all in one place.
Explore Hospitals