LAB · INSTRUMENT
Make the service answer
Add counters, gauges and histograms to a service and query them meaningfully.
> Observability · DevOpsSchool Training
Weekend and weekday batches, live online or in our Hyderabad classroom — every session a live demo in a real lab, not slides.
★ 4.8 / 5 from 2,300+ ratings18,000+ engineers certifiedTrained teams at JPMorgan Chase, Verizon, Nokia, World Bank
# upcoming batches
Times shown in IST (UTC+5:30). New cohorts start on the 1st of every month.
| Starts | Days & time | Timezone | Mode | Duration | Seats | Enrol |
|---|---|---|---|---|---|---|
| —Most popular | Weekend · Sat · Sun 10:00 AM – 1:00 PM | IST (UTC+5:30) | Live online · Classroom · Corporate onsite | 5 weekends | — of 10 left | Reserve |
| — | Weekday · Mon · Wed · Fri 8:00 – 10:00 PM | IST (UTC+5:30) | Live online · Classroom · Corporate onsite | 5 weeks | — of 10 left | Reserve |
Batches are capped at 10 learners by design.Need a date that isn't listed? Talk to us about a private batch →
# how you attend
Individuals, anywhere
Scheduled instructor-led batch. Every session is a live demo in a real lab, and every session is recorded.
Reserve my seatLearners who prefer in-person
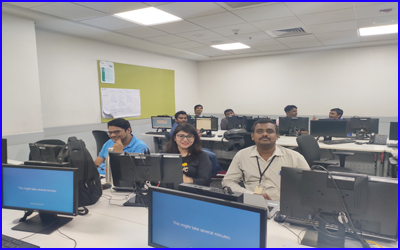
Palmeto Solutions, 8th Floor, Vaishnavi Cynosure, Telecom Nagar, Gachibowli, Telangana 500032. Landmark: Reliance Digital Building, next to Gachibowli Flyover. Classroom batches run when six or more learners in the city book the same cohort.
Check classroom availabilityTeams of 8–30
Custom agenda built from your stack, delivered at your office or online, in your timezone. NDA-friendly, invoiced against a PO.
Request a quoteSelf-starters
The full recorded curriculum plus a year of the entire LMS — 20+ courses and 50+ tools, not just this one.
Enroll now# private batches
We start with a discovery call, map your stack to the modules below, and drop anything your team already runs in production. Delivery is at your office, online, or hybrid — in your timezone, scheduled around your release calendar.
Send us the tools, the team size and a rough window. You'll get an agenda and a quote back, not a sales call.
# hyderabad
Prometheus with Grafana training in Hyderabad is taken mostly by developers instrumenting their own services and SREs defining SLOs and alerting. Sessions run live online in IST (UTC+5:30), or in our Hyderabad classroom when six or more learners in the city book the same cohort. Teams here often pair it with our Ansible and Artifactory training, and a corporate batch can cover more than one in a single engagement. Hyderabad's engineering base is unusually concentrated in a few large employers rather than spread across many small ones, and that shapes what a cohort here wants. Teams from the Financial District and Nanakramguda tend to arrive with an existing platform already chosen for them and a mandate to operate it well, so sessions lean toward operational depth — runbooks, upgrade paths, capacity and on-call — more than toward evaluating alternatives. The pharmaceutical and life-sciences presence adds a requirement that rarely comes up elsewhere in India: validated environments, where a change has to be evidenced as much as executed. Engineers from those teams push hard on change control, reproducible builds and audit trails, and the rest of the cohort usually benefits from the questions. Our Hyderabad centre is at Vaishnavi Cynosure in Gachibowli, next to the flyover, which is a short hop from HITEC City and Madhapur. Classroom cohorts run there when six or more learners in the city book the same batch; otherwise the same batch runs live online.
Palmeto Solutions
8th Floor, Vaishnavi Cynosure, Telecom Nagar, Gachibowli, Telangana 500032Landmark: Reliance Digital Building, next to Gachibowli Flyover
Classroom cohorts run when six or more learners in Hyderabad book the same batch. Otherwise the same batch runs live online.
# the subject
Prometheus scrapes metrics from instrumented targets, stores them as time series, and evaluates rules over them; Grafana queries that store and renders it. The concepts to internalise are the four metric types, labels and cardinality, and PromQL — particularly rate, histogram_quantile and aggregation, which is where most real queries live. Cardinality is the trap. A label with unbounded values will quietly destroy a Prometheus server, and the discipline of choosing labels carefully is more important than any dashboard technique.
This pair is the default open-source monitoring stack, and instrumentation has moved from an operations concern to something engineers are expected to build into their own services. Employers increasingly ask for SLO thinking — error budgets, burn-rate alerts — rather than dashboards, and that requires being fluent in PromQL rather than in clicking Grafana.
# outcomes
# curriculum
Every module follows the same shape: 5 hrs · 2 assignments · 1 capstone.
Introduction - Prometheus, Introduction to Prometheus, Prometheus installation, Grafana with Prometheus Installation, Monitoring, Introduction to Monitoring, Client Libraries, Pushing Metrics
Querying, Service Discovery, Exporters, Alerting, Introduction to Alerting, Setting up Alerts, Internals, Prometheus Storage
Prometheus Security, TLS & Authentication on Prometheus Server, Mutual TLS for Prometheus Targets, Use Cases, Monitoring a web application, Calculating Apdex score, Cloudwatch Exporter, Grafana Provisioning
Consul Integration with Prometheus, EC2 Auto Discovery, Introduction - Grafana, Introduction and Overview, What is Grafana?, Why do we need it?, Advantage and Disadvantage of Grafana, Grafana Comparing with other tools
How Grafana works!, Grafana Architecture, Installation, Requirements, Install on Debian/Ubuntu, Install on RPM-based Linux, Install on Windows, Install on macOS
Run Grafana Docker image, Upgrade Grafana, Getting Started with Grafana, With Grafana, With Grafana and Prometheus, With Grafana and MS SQL Server, Time Series, Time Series Dimensions, Histograms and Heatmaps, Glossary
Data sources in Grafana, PostgreSQL, Prometheus, Add data source, AWS CloudWatch, Cloud Monitoring, Azure Monitor, Elasticsearch
Graphite, InfluxDB, Jaeger, Loki, Tempo, Microsoft SQL Server, MySQL, OpenTSDB
TestData, Zipkin, Panels in Grafana, Add a Panel, Panel Editor, Calculations list, Queries, Thresholds
Transformations, Share query results, Inspect a panel, Field options and overrides, Visualizations, Dashboards & Explore in Grafana, Annotations, Dashboard Folders
Playlist, Search, Keyboard shortcuts, Time range controls, Reporting, Dashboard Version History, Share dashboard, Share panel
Export and import, JSON model, Scripted dashboards, Alerts in Grafana, Alert notifications, Create alerts, Pause alert rule, View alerts, Troubleshoot alerts
Open-book, scenario-based, taken in the LMS. Two free re-attempts and detailed feedback.
# hands-on
We don't hand out a sandbox that expires. You provision your own free-tier environment with our guidance, so the setup skill goes with you.
LAB · INSTRUMENT
Add counters, gauges and histograms to a service and query them meaningfully.
LAB · PROMQL
Answer five real questions about latency and errors using PromQL alone.
LAB · SLO
Define an SLO and build a multi-window burn-rate alert.
# toolchain
# pricing
₹833/mo
billed yearly ₹9,996
All recorded sessions, labs and the full LMS — at your own pace.
₹34,999₹49,999SAVE 30%
works out to ₹2,917/moIllustrative monthly equivalent. The full amount is charged once at enrolment; we do not offer instalments.
5-week live cohort plus the complete LMS bundle.
₹99,999
works out to ₹8,333/moIllustrative monthly equivalent. The full amount is charged once at enrolment; we do not offer instalments.
A dedicated senior practitioner. Pace, schedule and labs tailored to you.
+ GST 18% as applicable · Prices are charged in INR.
If we cancel or postpone a cohort and you decline the rescheduled session, you get a 100% refund within 15 days. Refund policy →
Recordings, slides and lab repos are licensed to you for your own learning. Terms →
We don't share your details with third parties. Privacy →
# who teaches it
Twenty years across DevOps, SRE and security, in principal and architect roles at PayPay, SoftwareAG, ServiceNow, Intuit, Adobe and IBM. Has personally trained more than 10,000 engineers at JPMorgan Chase, Verizon, Nokia, the World Bank and dozens more. He teaches what he runs, not what he reads.






# the credential
Certificate of Completion
Your Name
Prometheus with Grafana Training in Hyderabad
DS-PROMET-XXXX-XXXX
# reviews
4.8 / 5 from 2,300+ ratings.
Reviews for this program are being collected from public sources. Every review shown here links to the original.
# alternatives
| What matters | YouTube + blogs | Generic online course | Local training institute | DevOpsSchool |
|---|---|---|---|---|
| Teaching method | Unstructured, no sequence | Pre-recorded slides | Slide-led classroom | Live demos in a real lab |
| Batch size | n/a | Unlimited | 30–60 | Capped at 10 |
| Lab environment | Yours to figure out | Shared sandbox that expires | Shared lab | You build your own — the skill goes with you |
| Per-tool structure | None | Video only | Varies | 5 hrs · 2 assignments · 1 capstone |
| Assessment | None | Quiz | Attendance | 3 hours · online · open-book · scenario-based |
| Certificate | None | Auto-issued | Attendance certificate | Industry-recognised, verifiable |
| Corporate invoicing | No | Card only | Sometimes | PO, GST invoice, NDA |
| Post-training support | None | Forum for 30 days | None | Lifetime forum support |
| Total cost | Free, and it costs you months | Low, low completion | High | One fee, LMS included |
# questions
Yes. Classroom cohorts run at our Hyderabad centre when six or more learners in the city book the same batch. Below that number the batch runs live online with the same instructor and the same labs, and we tell you which it will be before you pay.
Sessions run in IST (UTC+5:30), which is local time for you: the weekend cohort at 10:00–13:00 on Saturday and Sunday, and the weekday cohort at 20:00–22:00 on Monday, Wednesday and Friday. Most Hyderabad learners take the weekend batch because it does not collide with a release window.
Most Hyderabad attendees work in Gachibowli, HITEC City, Madhapur, Kondapur, Financial District, Nanakramguda or Uppal. That matters for classroom batches, because we only open the Hyderabad centre when six or more learners from the city book the same cohort — and in practice that is who fills it.
The curriculum is the same everywhere — it is the same course, and pretending otherwise would be dishonest. What changes for Hyderabad is delivery: the batch times are set for IST (UTC+5:30), fees are shown in INR, and a classroom option exists here that most locations do not have. The examples our instructors reach for also tend to follow what Hyderabad teams actually run.
No, and that is deliberate. You build the labs on your own free-tier account, and we walk through the setup and the cost guardrails in week one. A sandbox that expires when the course ends teaches you nothing you keep; your own environment does.
Every session is recorded and available in the LMS the same day, and you keep access for a year. You can also sit the missed session again with the next cohort at no extra cost.
Comfortable on a Linux shell; A service you can instrument; Basic understanding of HTTP and metrics. If you are unsure whether you are ready, tell us what you work on now and we will give you a straight answer rather than a sales one.
You get an industry-recognised DevOpsSchool certificate after the three-hour open-book exam. Most people find the capstone repositories carry more weight in an interview than the certificate itself, which is why the labs are built to be shown.
Yes. We build the agenda from your stack after a discovery call and drop anything your team already runs in production. Teams of 8 to 30 work best; larger groups split into parallel batches.
If we cancel or postpone a cohort and you decline the rescheduled session, you get a full refund within 15 days. We do not offer a general money-back guarantee, and taxes and gateway fees are not refunded.
No. The fee is charged once at enrolment. Where we show a monthly figure it is arithmetic to help you size the cost against a budget, not a payment plan.
# keep learning
Everything below is open and free — no enrolment needed.
# in the room
# ready when you are