
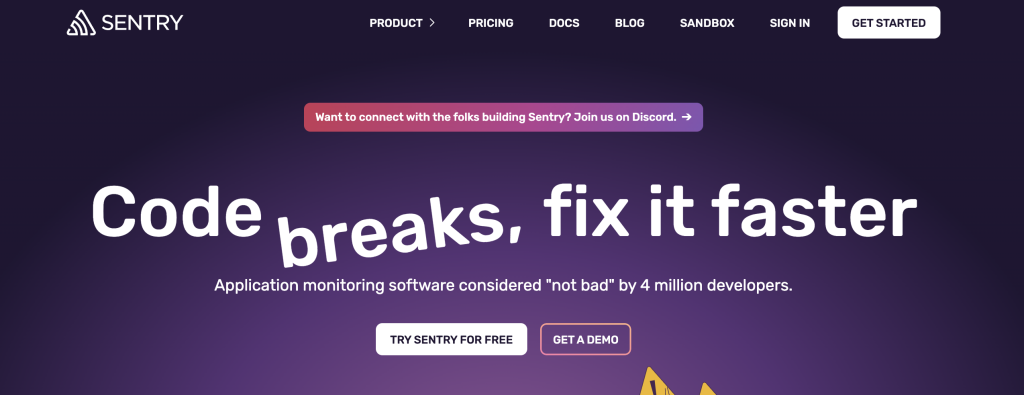
What is Sentry?
Sentry is a powerful open-source application monitoring and error tracking tool designed to help developers detect, diagnose, and resolve issues in real-time across web and mobile applications. It provides detailed insights into errors and performance bottlenecks, helping developers improve the reliability and stability of their software.
Key Features of Sentry:
- Real-time error tracking
- Performance monitoring
- Contextual information for debugging (stack trace, breadcrumbs, request data)
- Integration with popular tools (Slack, GitHub, Jira, etc.)
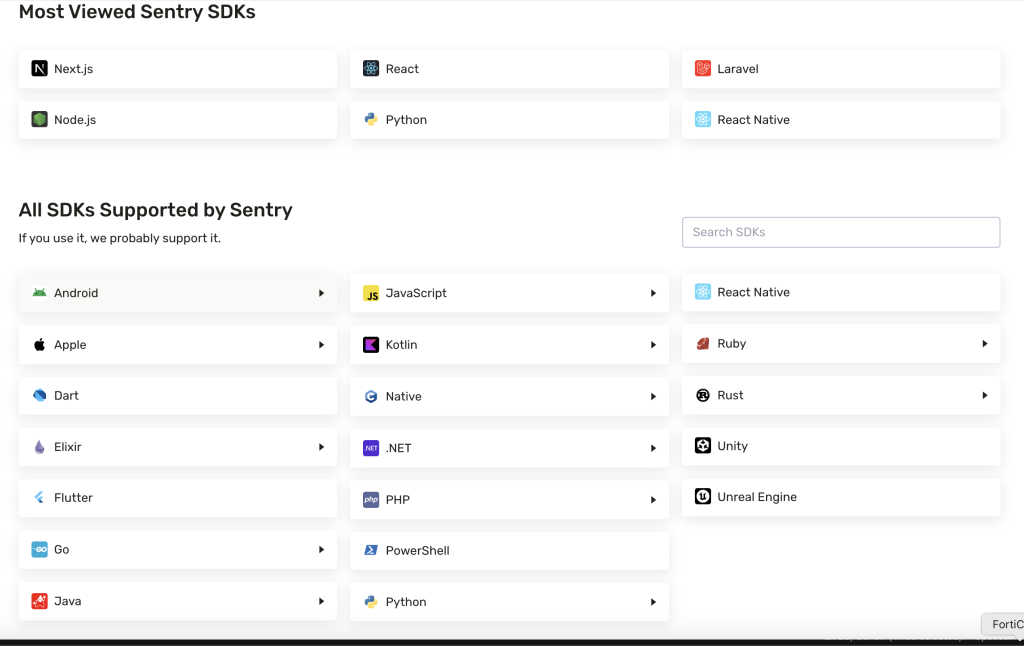
- Supports multiple programming languages (JavaScript, Python, PHP, Java, Ruby, etc.)
Official Website: https://sentry.io
Top 10 Use Cases of Sentry:
- Real-time Error Monitoring
Detect and get instant alerts on application errors and crashes. - Performance Tracking
Identify slow transactions and optimize application performance. - Error Aggregation and Analysis
Group errors by common causes and prioritize based on impact. - Integration with CI/CD Pipelines
Catch errors during development and deployments. - Release Tracking
Monitor new releases for errors and performance regressions. - User Context Analysis
Understand how individual users are affected by errors. - Frontend and Backend Coverage
Monitor errors across full-stack applications. - Security Issue Tracking
Detect and respond to potential security vulnerabilities. - Multi-environment Support
Track errors in different environments (Development, Staging, Production). - Cross-platform Monitoring
Support for mobile, web, and desktop applications.
What are the Alternatives to Sentry?
Here are some popular alternatives to Sentry:
| Tool | Description |
|---|---|
| Datadog | Comprehensive monitoring and analytics platform with error tracking. |
| Rollbar | Real-time error monitoring and debugging for cloud apps. |
| New Relic | Full-stack monitoring and error reporting for performance management. |
| Raygun | Error, crash, and performance monitoring for web and mobile apps. |
| AppSignal | Monitoring tool for Ruby, Elixir, and Node.js applications. |
| Honeybadger | Error monitoring, uptime monitoring, and check-in monitoring. |
| LogRocket | Frontend monitoring with session replay and error tracking. |
| Bugsnag | Application stability management and error monitoring. |
| Airbrake | Lightweight error tracking tool for multiple languages. |
| Splunk | Log management with AI-driven insights and security monitoring. |
How Sentry Works and Its Architecture
Sentry captures errors and performance data from your applications and provides real-time insights for debugging and resolving issues.
- Error Collection: Sentry SDKs are integrated into the application code to automatically capture errors, exceptions, and performance traces.
- Data Transmission: Collected data is sent to the Sentry server (cloud-hosted or self-hosted).
- Processing and Grouping: Sentry groups errors based on stack trace similarities, identifies unique issues, and enriches data with user context and environment info.
- Notification and Alerts: Alerts are sent to configured channels (Slack, email, etc.) based on rules.
- Analysis and Debugging: Developers access the Sentry dashboard for detailed error reports, tracebacks, and context to fix issues.
Terminology Used in Sentry
Here are key terms in Sentry:
| Term | Description |
|---|---|
| Event | A single occurrence of an error or performance issue. |
| Issue | Grouping of similar events with shared characteristics. |
| Breadcrumbs | A trail of events (like logs) leading to an error, useful for debugging. |
| Transaction | A performance event that tracks operations and their duration (e.g., API requests). |
| Release | A specific version of your application, used for monitoring and error correlation. |
| Environment | The application environment (Production, Staging, Development, etc.). |
| SDK | Sentry’s client library for integrating with different programming languages. |
| Tags | Custom key-value pairs attached to events for categorization and filtering. |
| Session | Represents a user session and tracks session-based metrics like crash rate. |
Sentry’s Unique Features (Key Differentiators)
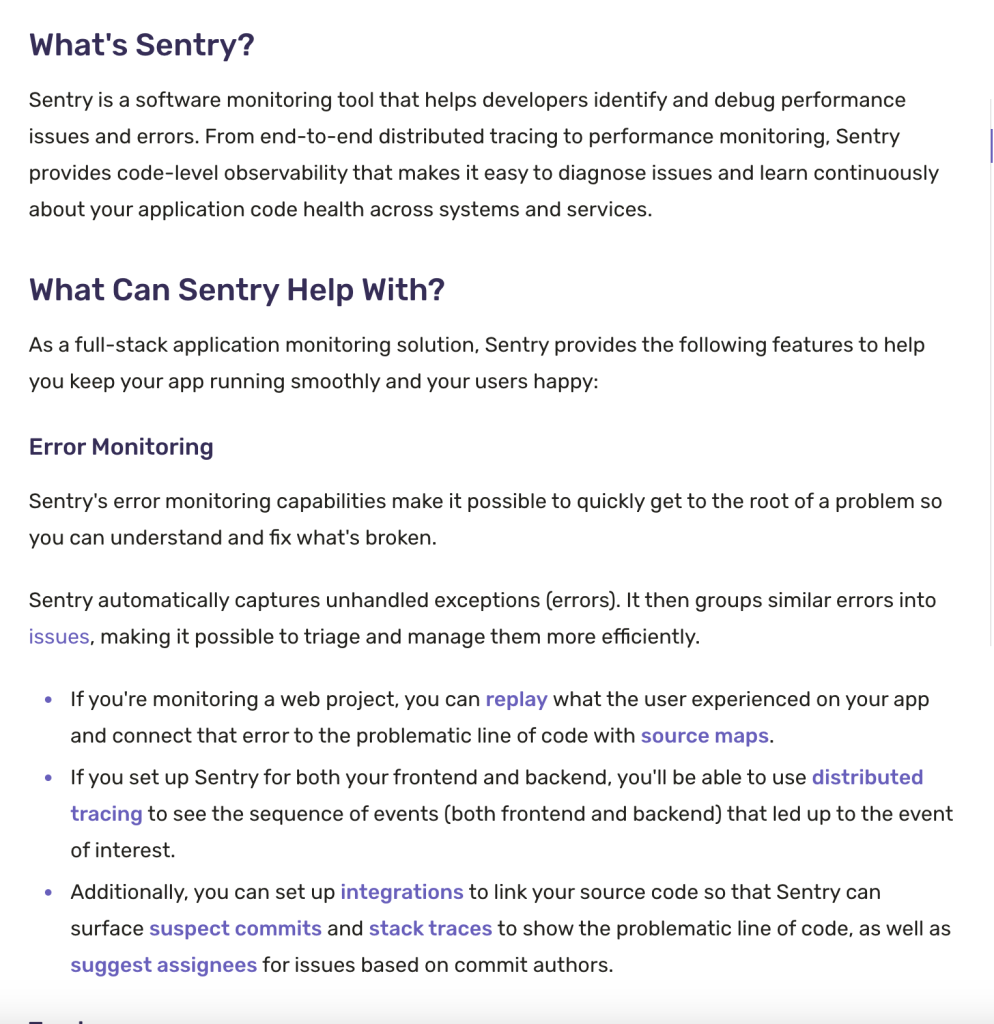
- Error Monitoring
- Focused on code-level insights for detecting and debugging errors at the root cause.
- Helps developers track down specific lines of code, making it easier to fix bugs faster.
- Datadog and New Relic do error tracking but lack this deep code context and tailored stack trace view.
- Session Replay(Highly Unique)
- Watch real user sessions to visually see what the user experienced before an error.
- Helps reduce back-and-forth between support and dev teams by reproducing issues directly.
- Datadog/New Relic don’t have session replay capabilities built specifically for frontend and mobile debugging.
- Tracing (Distributed Tracing)
- Track a complete end-to-end request journey, making it easier to correlate errors with specific user actions.
- Comparable to Datadog’s Distributed Tracing, but Sentry’s tracing is more developer-oriented and directly tied to application code.
- New Relic also offers distributed tracing, but it’s more focused on large-scale systems and infrastructure metrics.
- Uptime Monitoring(Basic but Valuable)
- Provides basic uptime checks and alerts for your website or APIs.
- While not as advanced as Datadog’s synthetic monitoring, it’s perfect for developers who just want to ensure that services stay up and get quick alerts.
- Profiling (Code-level Performance Analysis)(Unique for Developers)
- Gives production-level performance insights by identifying slow functions at the code level (CPU usage, function-level bottlenecks).
- Not available in Datadog/New Relic in the same developer-centric, code-first format.
- Cron Monitoring(Rare Feature)
- Monitor scheduled jobs (e.g., cron jobs) to detect failures and flaky behaviors.
- Unlike Datadog or New Relic, Sentry provides contextual error tracking for cron failures directly in your application.
- Code Coverage(Exclusive for Debugging)
- Helps you see if the faulty code is partially or fully covered by tests, which can avoid similar future errors.
- This kind of code coverage insight is unavailable in Datadog or New Relic.
- User Feedback Collection
- Sentry lets you collect user feedback with debugging context (session replay, errors, device tags) to provide real-world insights from users.
- Datadog and New Relic focus on synthetic data and infrastructure monitoring rather than actual user feedback.
How to Decide Based on These Features
- If you are a developer working on error-prone or performance-sensitive applications, Sentry is the best choice because it gives you everything from code-level insights to performance traces and user session replays in one tool.
- If you are an SRE or DevOps Engineer, Datadog and New Relic are more suitable for monitoring infrastructure, distributed systems, and network performance.
- If you want to combine them, use Sentry for error and performance monitoring at the application level, and Datadog/New Relic for infrastructure metrics, log aggregation, and synthetic monitoring.
- Does Sentry Run in Production?
Yes, Sentry is designed to run in production to monitor real-world application errors and performance issues.- It provides code-level insights directly from the production environment without affecting performance.
- You can also use Sentry in pre-production environments (QA/Staging) to catch errors early during testing.
- Is Sentry More Dev-Focused?
Absolutely. Sentry is a developer-first tool with a heavy focus on code and user-level context, while Datadog and New Relic are more suitable for Ops/SRE and infrastructure monitoring.
Yes, Sentry can be classified as an APM (Application Performance Monitoring) tool, but with a focus on error tracking and performance monitoring. Unlike full-fledged APM tools like New Relic or Datadog, Sentry specializes in monitoring and debugging application errors and slow performance traces.
Why Sentry is considered an APM tool:
- Performance Monitoring:
Tracks application performance, identifies bottlenecks, and provides transaction-level insights. - Error Tracking and Reporting:
Captures detailed information about errors, exceptions, and stack traces. - Real-time Monitoring:
Helps monitor latency, error rates, and throughput in real-time. - Integration with DevOps:
Seamlessly integrates with CI/CD tools and DevOps pipelines to enhance application reliability. - User Impact Analysis:
Provides insights into how errors affect users and prioritizes fixes based on user impact.
When is Sentry not a Full APM Tool?
Compared to traditional APM tools, Sentry focuses more on:
- Error and Exception Tracking
- Performance Tracing (but without advanced infrastructure monitoring)
- Application-level monitoring, not system-level (no monitoring of CPU, memory, or container performance like Datadog or New Relic).
If you want full-stack APM (including server, database, and infrastructure monitoring), tools like Datadog, New Relic, or Dynatrace might be better.
Here’s a comprehensive comparison between Sentry, Datadog, and New Relic across key criteria like features, pricing, and use cases.
Overview of Sentry, Datadog, and New Relic
| Tool | Description |
|---|---|
| Sentry | Focuses on error tracking and performance monitoring for applications. Great for debugging and issue resolution. |
| Datadog | Full-stack monitoring platform for infrastructure, application performance, logs, and security monitoring. |
| New Relic | Comprehensive APM tool covering application performance, server monitoring, logs, synthetics, and infrastructure. |
Feature Comparison Table
| Feature | Sentry | Datadog | New Relic |
|---|---|---|---|
| Primary Focus | Error and performance monitoring | Full-stack monitoring & APM | Application & infrastructure APM |
| Error Tracking | Yes | Limited | Yes |
| Performance Monitoring | Yes (Transaction traces) | Yes (Detailed APM) | Yes (Detailed APM) |
| Infrastructure Monitoring | No | Yes | Yes |
| Log Management | Limited | Yes | Yes |
| User Impact Analysis | Yes | No | Yes |
| Real-time Alerts | Yes | Yes | Yes |
| Integration with CI/CD | Yes | Yes | Yes |
| Custom Dashboards | Limited | Extensive | Extensive |
| Mobile Support | Yes | Yes | Yes |
| Supported Languages | Multiple (Python, JS, Ruby, etc.) | Multiple | Multiple |
| Deployment Tracking | Yes | No | Yes |
| Synthetics & Uptime Monitoring | No | Yes | Yes |
| Pricing Model | Per user/event | Per host/per usage | Per host/per usage |
| Best For | Developers for error tracking | DevOps & SRE teams | Enterprise APM & monitoring |
Detailed Feature Comparison
1. Error Tracking & Crash Reporting
- Sentry: Best in class for error tracking, with rich stack traces, breadcrumbs, and user context. Ideal for debugging.
- Datadog: Primarily focused on performance; error tracking is available but less robust than Sentry.
- New Relic: Offers error tracking with crash analytics, similar to Sentry but integrated with full-stack monitoring.
2. Performance Monitoring
- Sentry: Focuses on transaction tracing, which helps track slow requests and API calls. Great for frontend and backend apps.
- Datadog: Provides comprehensive APM with flame graphs, distributed tracing, and in-depth application performance metrics.
- New Relic: Offers advanced performance monitoring with distributed tracing and real-time analytics.
3. Infrastructure Monitoring
- Sentry: No infrastructure monitoring.
- Datadog: Full infrastructure monitoring, including containers, VMs, cloud providers, and network devices.
- New Relic: Covers infrastructure metrics and server health monitoring, similar to Datadog.
4. Log Management
- Sentry: Limited to basic logs related to errors.
- Datadog: Comprehensive log management with centralized logging and correlation with metrics.
- New Relic: Integrated log monitoring with full correlation to APM metrics and traces.
5. User Interface and Dashboards
- Sentry: Simple and developer-centric interface focused on error monitoring and performance traces.
- Datadog: Highly customizable dashboards for infrastructure and performance data.
- New Relic: Extensive dashboards and visualization with AI-driven insights.
Pricing Comparison
| Tool | Pricing Model | Free Plan | Paid Plan |
|---|---|---|---|
| Sentry | Per user/event-based pricing | Yes | Starts at $26/month/user |
| Datadog | Per host + usage-based pricing | Yes | Starts at $15/host/month |
| New Relic | Usage-based (data ingested/transactions) | Yes | Starts at $99/month |
Note: Pricing can vary based on specific modules (APM, logs, synthetics, etc.).
Use Cases
| Use Case | Best Tool |
|---|---|
| Error Tracking & Debugging | Sentry |
| Infrastructure & Cloud Monitoring | Datadog |
| Application Performance Management | New Relic |
| Full-stack Monitoring | Datadog/New Relic |
| Frontend and Backend Error Insights | Sentry |
Conclusion: Which Tool to Choose?
- Choose Sentry if you want an error tracking and performance monitoring tool for applications with minimal overhead. Ideal for developers and engineering teams focused on debugging.
- Choose Datadog if you need full-stack monitoring covering infrastructure, applications, logs, and security. Best for DevOps, SREs, and cloud environments.
- Choose New Relic if you want enterprise-level APM with end-to-end visibility across your stack. It’s suitable for large organizations looking for comprehensive monitoring.

I’m Rajesh Kumar, a DevOps, SRE, DevSecOps, Cloud, and Platform Engineering expert passionate about sharing practical knowledge, real-world experiences, and industry best practices. I have worked at Cotocus and regularly write about technology, travel, investing, health, product reviews, and digital marketing through my various platforms.
I publish technical articles at DevOps School, travel stories at Holiday Landmark, stock market insights at Stocks Mantra, health and fitness guidance at My Medic Plus, product reviews at TrueReviewNow, and SEO and digital marketing strategies at Wizbrand.
Find Trusted Cardiac Hospitals
Compare heart hospitals by city and services — all in one place.
Explore Hospitals