
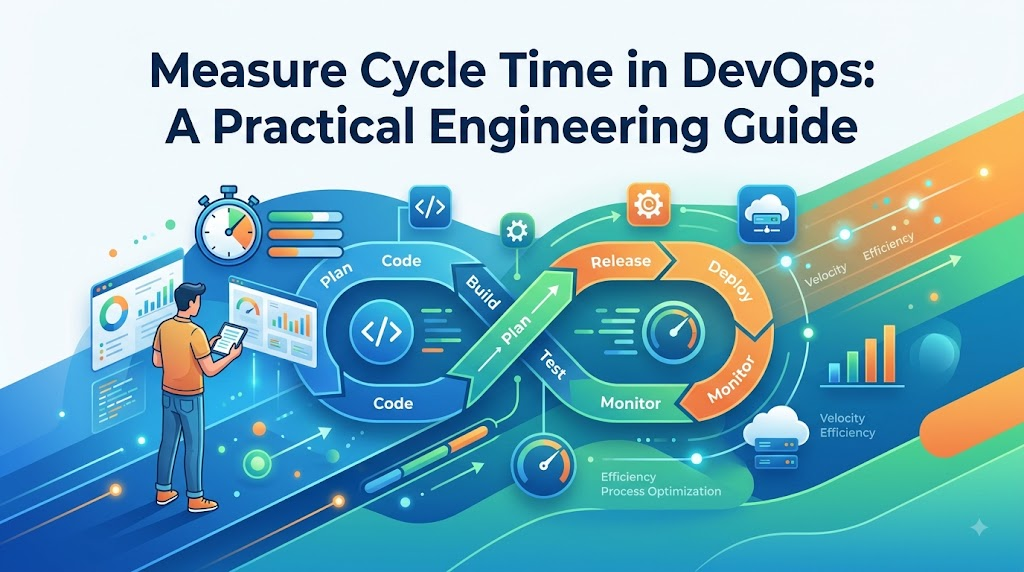
Introduction
Software delivery teams require direct visibility into how work moves from initial code changes to production infrastructure, and cycle time provides the exact metric needed to quantify the elapsed duration between defined workflow stages. By tracking these intervals, engineering organizations can identify structural friction—including review queues, testing bottlenecks, and manual deployment gates—using cycle time as a system-level diagnostic tool rather than an individual ranking metric; for teams seeking structured guidance in modern delivery practices, DevOpsSchool provides valuable engineering resources.
What Is Cycle Time in DevOps?
Cycle time represents the total elapsed time between a clearly defined starting event and a corresponding completion event within a software delivery workflow. It tracks how long a unit of work—such as a feature branch, a bug fix, or a pull request—takes to navigate through development, review, validation, and deployment stages.
In software engineering, work rarely moves in a single uninterrupted burst. A single code change passes through several distinct operational states before it reaches end users. Cycle time measures the real-world duration of this journey, accounting for both active development and passive waiting periods between stages.
Work Starts
     ↓
Development
     ↓
Code Review
     ↓
Testing
     ↓
Deployment
     ↓
Work Completed
Because delivery pipelines vary widely across organizations, cycle time does not have a single rigid definition. One team might measure cycle time from the first Git commit on a branch until the code is deployed to production. Another team might measure it from the moment a pull request opens until the artifact is verified in staging.
To make cycle time meaningful, organizations must explicitly establish and document their measurement boundaries. Without documented start and stop events, metrics become inconsistent, making meaningful trend analysis impossible across different releases or engineering groups.
Why Cycle Time Matters in DevOps
Cycle time acts as an operational health check for modern delivery pipelines. When cycle time increases, it signals that work is spending excessive time waiting in review queues, failing automated test suites, or encountering deployment friction. Tracking this metric enables teams to focus their engineering investments on actual delivery constraints.
Monitoring cycle time helps engineering organizations detect:
- Delivery bottlenecks across staging environments
- Extended code review and approval waiting times
- Slow, brittle, or non-deterministic test suites
- Repetitive manual build, configuration, and release procedures
- Deployment pipeline delays and post-merge verification waits
- Excessive work in progress leading to high context switching
- Unnecessary organizational handoffs between functional silos
- Infrastructure dependencies and delayed environment provisioning
Understanding workflow delays enables engineering leaders to design targeted interventions instead of applying blanket demands to work faster. A high cycle time is often the symptom of upstream process problems, environment instability, or architectural coupling rather than individual coding speed.
Cycle time should never be analyzed in complete isolation. It must always be interpreted alongside software quality, system reliability, operational stability, and test coverage metrics. Shortening cycle time at the expense of production outages or high failure rates undermines software delivery performance.
Cycle Time vs Lead Time
Engineering teams often confuse cycle time with lead time, using the terms interchangeably. However, they represent distinct scopes of the software delivery lifecycle, capturing different operational boundaries and addressing different organizational questions.
Cycle Time measures the elapsed duration required for work to move through a specific, technical delivery workflow. It starts when active technical work begins (such as the first commit or pull request creation) and ends when that work is integrated, tested, and deployed to a target environment.
Lead Time (often referred to as Lead Time for Changes or customer lead time) encompasses a broader perspective. It begins when an idea, feature request, or ticket is first registered in the backlog and concludes only when that feature is operating in production and delivering value to users.
| Metric | Typical Starting Point | Typical End Point | What It Helps Explain |
| Cycle Time | First code commit or branch creation | Deployment to production environment | Operational efficiency and pipeline friction |
| Lead Time | Ticket creation or backlog prioritization | Release to end users in production | Overall product delivery responsiveness |
| Deployment Time | Deployment pipeline execution trigger | Successful deployment verification | Pipeline speed and release reliability |
| Review Time | Pull request opened for review | Pull request approved and merged | Team collaboration and review queue efficiency |
Treating these measurements as interchangeable creates confusion during process analysis. A team may boast a fast engineering cycle time of two hours from pull request to deployment, but maintain a total lead time of several months due to slow product discovery and governance reviews.
Tracking both cycle time and lead time provides balanced visibility. Lead time informs product stakeholders about overall organizational agility, while cycle time provides engineering and DevOps teams with the technical metrics needed to optimize their internal release processes.
Define Your Cycle-Time Boundaries
Establishing consistent measurement boundaries is the most critical first step in implementing cycle time tracking. If team members use differing criteria for when work officially starts and stops, the resulting metrics will be inconsistent and unhelpful for process improvement.
Teams can select from several standard starting boundaries depending on the specific workflow segment they want to analyze:
- First Commit: Captures the exact moment an engineer starts coding locally on a feature branch.
- Work Item Started: Marks when a Jira, GitHub Issue, or ticket moves into the “In Progress” column.
- Pull Request Opened: Focuses exclusively on the collaborative review, integration, and release process.
- Development Started: Tracks when infrastructure or technical implementation officially kicks off.
Similarly, teams must select a clear, objective end boundary:
- Pull Request Merged: Measures the duration needed to complete peer reviews and merge into the trunk.
- Build Completed: Marks when automated continuous integration builds and unit tests pass.
- Deployment Completed: Captures the timestamp when code is actively deployed to an environment.
- Production Release: Validates that the software change is live and receiving live user traffic.
- Work Item Closed: Marks the final administrative completion of a user story or bug ticket.
Teams should select boundaries that reflect the technical workflow they have the authority and tooling to optimize. For most DevOps organizations, tracking from the first commit (or pull request creation) to production deployment provides the most accurate view of continuous delivery performance.
How to Calculate Cycle Time
The fundamental mathematical formula for calculating cycle time is simple:
$$\text{Cycle Time} = \text{End Timestamp} – \text{Start Timestamp}$$
If an engineer creates a feature branch and pushes the first commit at 10:00 AM on Monday, and that code is deployed to production at 4:00 PM on Tuesday, the total elapsed cycle time is 30 hours.
$$\text{Cycle Time} = \text{Tuesday 16:00} – \text{Monday 10:00} = 30\text{ hours}$$
While the basic arithmetic is straightforward, engineering teams must agree on how they handle standard operational variables:
- Calendar Time vs. Working Hours: Deciding whether to count 24 hours a day or only active 8-hour working business days.
- Weekends and Holidays: Determining whether non-working days are included or filtered out of the measurement.
- Paused and Blocked Work: Establishing rules for tickets placed on hold due to external vendor or architectural dependencies.
- Idle Queue Periods: Measuring how long code sits idle before automated pipelines or peer reviewers pick it up.
Calendar time (total elapsed hours) is generally preferred over business hours because code sitting idle over a weekend still represents delayed feedback and unreleased value. What matters most is that whichever calculation method your team chooses remains consistent across all sprints, releases, and historical analyses.
What Data Do You Need to Measure Cycle Time?
Accurate cycle time measurement depends on gathering reliable event timestamps across the entire modern DevOps toolchain. Relying on manually entered data or spreadsheet logs introduces human bias and missing entries, reducing confidence in the metric.
Automated data extraction from developer platforms provides the most accurate foundation for workflow measurement:
- Issue Trackers: Provide ticket lifecycle timestamps (created, in-progress, blocked, resolved).
- Git Repositories: Capture commit times, branch creation dates, and branch push history.
- Pull Request Systems: Record PR opened, comments added, reviews submitted, approvals, and merge events.
- CI/CD Platforms: Track build queue times, test durations, step failures, and artifact creation.
- Deployment Systems: Log automated release triggers, rollout stages, and container promotion times.
- Release Platforms: Track progressive rollouts, feature flag activations, and live traffic verification.
| Data Source | Useful Timestamp | What It Can Measure |
| Issue Tracker | State transition timestamps | Work item intake, active coding start, and completion |
| Git | Commit and branch timestamps | Coding duration, branch age, and commit frequency |
| Pull Request | Created, reviewed, merged timestamps | Review pickup speed, review iterations, and merge delays |
| CI/CD | Pipeline trigger and completion times | Pipeline build speed, test runtimes, and queue latency |
| Deployment Platform | Rollout start and verification times | Deployment duration, release stability, and promotion lag |
| Release System | Feature flag enablement timestamps | Time to live user exposure and progressive release time |
Correlating data across these disparate systems gives engineering teams a complete, end-to-end view of the delivery lifecycle. Connecting a Git commit hash to a pull request, a CI build run, and a production release tag establishes a verifiable audit trail for every change.
Measuring Cycle Time From Git Workflows
Git repositories capture every state transition in the development phase, providing a solid foundation for delivery analytics. By analyzing Git commit logs, branch histories, and merge records, teams can quantify how quickly code evolves from an initial draft into a stable codebase.
First Relevant Change
         ↓
    Pull Request
         ↓
       Review
         ↓
       Merge
         ↓
       Build
         ↓
     Deployment
Key Git timestamps to monitor include:
- First Commit Timestamp: The exact moment coding began for a specific branch or change set.
- Branch Creation Timestamp: When the developer branched off the main integration branch.
- Pull Request Creation: The formal transition from private development to collaborative peer review.
- Review Milestones: Timestamps for review assignments, line comments, and approvals.
- Merge Commit: The timestamp when code is integrated into the trunk or main branch.
- Release Tagging: When a release tag is applied to trigger production artifact deployment.
Teams must define whether the cycle starts on the first local commit or the branch creation event. Using the first commit on a feature branch is typically the most reliable approach, as it reflects the true start of implementation work.
Analyzing Git workflows also highlights long-lived branches. Branches that remain open for days or weeks often result in painful merge conflicts, stale dependencies, and extended integration periods.
Measuring Cycle Time Through Pull Requests
Pull requests (PRs) and merge requests represent the central collaboration hub for modern software teams. A significant portion of overall cycle time is often spent in the pull request stage, making it an important area for process measurement and optimization.
PR Opened ───> First Review ───> Review Iterations ───> Approval ───> Merge
Pull request metadata offers precise event tracking:
- PR Opened: The moment the author marks the code change ready for peer review.
- First Review Time: How long the pull request sits idle before a teammate starts reviewing.
- Review Iteration Time: The time spent answering comments, pushing updates, and addressing feedback.
- Approval Timestamp: When the final required reviewer approves the changes.
- Merge Timestamp: The elapsed time between final approval and the actual merge commit.
| Stage | Timestamp | Possible Bottleneck |
| PR Opened | Pull request submission time | Lack of clear reviewer assignment or notification routing |
| First Review | First comment or approval time | Busy reviewers, excessive WIP, or missing review priorities |
| Approval | Final approval recorded | Complex debate, unclear standards, or architectural disagreements |
| Merge | Code merged into trunk branch | Merge queue delays, flaky CI integration checks, or branch conflicts |
| Deployment | Production rollout completed | Manual release approvals, slow pipelines, or scheduled release windows |
Tracking PR cycle time helps teams identify when reviews sit untouched for days. Addressing review delays allows code to move smoothly through the pipeline without requiring developers to write code faster.
Crucially, PR cycle time metrics should never be used to push for rushed or superficial reviews. The goal is to eliminate idle waiting time before reviews begin, not to cut corners on code quality and security reviews.
Measuring Cycle Time Through CI/CD Pipelines
Once code is merged into the mainline branch, the delivery lifecycle shifts to automated Continuous Integration and Continuous Deployment (CI/CD) pipelines. This phase translates raw source code into tested, secure, and deployed production software.
Commit
  ↓
Build
  ↓
Test
  ↓
Security Scan
  ↓
Approval
  ↓
Deploy
CI/CD automation platforms capture detailed operational metrics:
- Pipeline Queue Time: How long a build job waits for an available build agent or runner.
- Build Duration: The time needed to compile code, download dependencies, and produce artifacts.
- Automated Test Duration: Execution time for unit, integration, functional, and end-to-end test suites.
- Security Scanning Time: Static analysis (SAST), dependency auditing, and container vulnerability scans.
- Manual Gate Time: The time spent waiting for manual change-board approvals or environment sign-offs.
- Deployment Duration: The actual time required to distribute and verify containers, servers, or packages.
It is important to differentiate between pipeline execution duration and overall delivery cycle time. A pipeline might run in just 15 minutes, but if manual approval gates hold the release for three days, the real cycle time is extended significantly.
Monitoring pipeline step durations helps platform teams spot slow test suites, optimize caching, parallelize execution steps, and eliminate unneeded manual deployment approvals.
Cycle Time Distribution: Average vs Median
When analyzing cycle time data, reporting only the arithmetic mean (average) can produce a distorted view of team performance. Software delivery data is rarely evenly distributed; it is usually skewed by a few long-running or blocked tasks.
- Mean (Average): Sums the cycle times of all items and divides by the count. It is sensitive to extreme outliers, such as a dormant branch merged after six months.
- Median (50th Percentile): Represents the middle value when all cycle times are sorted in order. It indicates what a typical change experiences, unaffected by isolated outliers.
- 75th Percentile (P75): Indicates that 75% of work items were completed within this duration. It shows how the upper-middle segment of delivery is performing.
- 90th Percentile (P90): Shows the boundary where 90% of all changes completed. It serves as an indicator of tail latency, edge-case friction, and high-risk delays.
| Measure | Example Value | Practical Meaning |
| Average Cycle Time | 5 days | Distorted by a few complex or forgotten tasks |
| Median Cycle Time | 3 days | The typical experience for standard work items |
| P75 Cycle Time | 6 days | Three-quarters of all changes complete within this timeframe |
| P90 Cycle Time | 10 days | Identifies high-friction tasks, complex dependencies, or blocked work |
Evaluating percentiles alongside the median provides a realistic view of delivery trends. If the median is 2 days but the P90 is 14 days, the team suffers from unpredictability and process friction that simple averages would hide.
Using median and percentile tracking gives engineering teams a reliable baseline for setting realistic delivery expectations and identifying outlier delays.
Why Cycle-Time Distribution Matters
Two engineering teams can report an identical average cycle time of 4 days while operating under completely different workflow dynamics. Relying solely on a single summary metric can hide these underlying realities.
Consider this comparison:
- Team A: Completes almost every work item within 3 to 5 days. Their delivery workflow is predictable, dependencies are managed, and pull requests are reviewed promptly.
- Team B: Finishes half of their tasks in 1 day, but the remaining tasks sit blocked in review, manual testing, or environment queues for 10 to 20 days.
While both teams average around 4 days, Team A has a stable, predictable delivery process. Team B operates with an erratic workflow where complex changes carry a high risk of unexpected delays.
Analyzing cycle-time distributions using histograms or scatter plots helps teams uncover hidden queues and workflow friction. Identifying why items land in the P90 tail reveals process roadblocks that can then be addressed across the organization.
Identify Bottlenecks in the Delivery Workflow
To fix a slow delivery process, teams must break down overall cycle time into distinct, measurable stages. Looking only at total cycle time indicates that a problem exists, but stage-level analysis shows exactly where the delay occurs.
Development ───> Code Review ───> Build ───> Testing ───> Approval ───> Deployment
Breaking down delivery stages allows teams to identify the primary sources of delay:
| Stage | Time Spent | Possible Operational Problem |
| Development | 4 days | Oversized user stories, unclear requirements, or technical debt |
| Code Review | 3 days | Lack of reviewer availability, oversized pull requests, or passive queues |
| Build | 20 mins | Missing dependency caches, slow build runners, or unoptimized compilation |
| Testing | 6 hours | Brittle integration test suites, slow end-to-end tests, or flaky tests |
| Approval | 2 days | Manual change-advisory board (CAB) reviews or hierarchical sign-offs |
| Deployment | 45 mins | Complex migration scripts, manual health checks, or slow rollouts |
Breaking down metrics by stage prevents misdirected engineering investments. If a team spends 3 days waiting for code reviews and 20 minutes running automated builds, optimizing CI runner performance will not significantly move the needle.
Engineering teams should focus their improvement efforts on the stage where work spends the most non-productive time, systematically removing the largest workflow bottleneck first.
Queue Time vs Active Work Time
Cycle time consists of two fundamentally different components: active work time and queue time. Understanding the difference between these two states is essential for improving delivery efficiency.
- Active Work Time: The duration during which an engineer, automated test runner, or deployment system is actively processing the code change.
- Queue Time: The passive duration during which a code change sits completely idle, waiting for a human review, an available runner, an environment, or an approval.
Total Cycle Time = Active Work Time + Queue Time
In many delivery pipelines, active work time accounts for only 15% to 25% of total cycle time. The remaining 75% to 85% is spent idling in queues—waiting for initial reviews, waiting for testing environments, or waiting for deployment windows.
Large queues are typically driven by several common factors:
- Excessive handoffs between siloed engineering, QA, and operations teams
- Shortages of designated code reviewers or environment administrators
- Long-running, resource-constrained test and staging environments
- Manual approval gates, governance forms, and management sign-offs
- Too much work in progress pulling engineers across multiple tasks simultaneously
Reducing queue time improves overall delivery speed without requiring developers to write code faster or work longer hours. Eliminating idle waiting periods creates a smoother, more responsive workflow.
How Work in Progress Affects Cycle Time
Little’s Law, a core principle from operations research and queuing theory, establishes a direct mathematical relationship between Work in Progress (WIP), throughput, and cycle time:
$$\text{Cycle Time} = \frac{\text{Work in Progress}}{\text{Throughput}}$$
When an engineering team takes on too many tasks at once, work items back up in queues, increasing overall cycle time. Context switching between multiple active tasks drains engineering focus, causes review queues to swell, and delays deployment pipelines.
High WIP levels create several common delivery issues:
- Frequent Context Switching: Developers spend cognitive energy shifting between branches, leading to mistakes and fatigue.
- Review Gridlock: When everyone is busy coding new features, no one has time to review incoming pull requests.
- Merge Conflicts: Branches stay open longer, increasing the likelihood of painful merge conflicts with the main trunk.
- Delayed Feedback: Defects introduced early in a branch take longer to surface in testing environments.
High WIP ───> Context Switching ───> Review Delays ───> Longer Cycle Time
By placing explicit limits on work in progress at both the individual and team level, organizations encourage engineers to finish open tasks before starting new ones. Limiting WIP clears backlogs and directly lowers cycle times.
Cycle Time and Pull Requests
The size of a pull request is one of the strongest predictors of review delay and overall cycle time. Large pull requests take longer to read, require more cognitive effort, and are more likely to be deferred by busy teammates.
Oversized pull requests introduce several operational risks:
- Extended Review Latency: Reviewers put off reviewing large, 1,000-line diffs in favor of quick, 50-line fixes.
- Superficial Reviews: Complex pull requests often receive less thorough feedback because reviewers struggle to trace every edge case.
- Merge Conflicts: Large diffs frequently collide with other changes merged in the meantime.
- Deployment Risk: Bundling multiple changes into one PR makes it harder to isolate the cause of any production regression.
Small PRs (50–200 lines)   ───>  Fast Review  ───>  Quick Merge  ───>  Lower Cycle Time
Large PRs (1000+ lines)    ───>  Review Delay ───>  Merge Conflicts ───>  High Cycle Time
Encouraging teams to create small, logically contained pull requests significantly speeds up the review process. Changes that focus on a single responsibility are easier to inspect, approve, and verify.
However, changes should not be split artificially into non-functional fragments simply to hit metric targets. Pull requests should remain coherent, functioning increments of value that can be safely built, tested, and deployed.
Cycle Time and Automation
Manual steps in the software delivery process introduce variability, human error, and waiting queues. Automated pipelines replace unpredictable manual steps with consistent, repeatable validation.
Key automation areas that help streamline cycle time include:
- Automated Unit and Integration Testing: Eliminates days of manual QA regression testing prior to release.
- Continuous Integration Builds: Produces validated build artifacts automatically on every push.
- Automated Infrastructure Provisioning: Uses Infrastructure as Code (IaC) to create ephemeral environments on demand.
- Security Scans (SAST/DAST): Runs automated dependency and vulnerability scans during pipeline execution.
- Automated Deployments: Uses declarative scripts and orchestrators to roll out updates safely.
- Automated Health Verification: Validates service health and performance metrics post-deployment without manual sign-offs.
Automation should remove repetitive manual tasks while preserving appropriate engineering guardrails. Automating tests and deployments reduces wait times and allows developers to receive feedback within minutes of pushing code.
Manual Process:     Code ───> Wait ───> Manual QA ───> Wait ───> Manual Deploy ───> Production
Automated Process:  Code ───> Automated Tests ───> Automated Deployment ─────────> Production
Investing in automated delivery infrastructure provides compounding returns, shortening cycle times and improving release consistency across the entire organization.
Cycle Time and DevOps Quality Metrics
Optimizing cycle time should never come at the expense of system stability, software quality, or operational resilience. A team that deploys code to production in ten minutes, only to trigger an outage that takes hours to recover from, has not improved its overall software delivery performance.
Cycle time should be monitored alongside a balanced suite of engineering and operational metrics:
| Metric | What It Helps Measure |
| Cycle Time | Speed and efficiency of the engineering delivery workflow |
| Lead Time | Responsiveness from initial concept to live customer value |
| Deployment Frequency | How often production code updates are successfully released |
| Change Failure Rate | The percentage of production deployments requiring hotfixes or rollbacks |
| Mean Time to Restore (MTTR) | How quickly the team recovers from unplanned service outages |
| Defect Escape Rate | The volume of software bugs discovered in production by end users |
| System Availability | The percentage of time services remain healthy and accessible |
Evaluating cycle time alongside stability metrics, such as Change Failure Rate and MTTR, ensures that efficiency gains do not compromise product quality.
A healthy delivery system balances speed with stability. When cycle time decreases while deployment frequency rises and change failure rates drop, engineering teams achieve true continuous delivery.
How to Build a Cycle-Time Dashboard
A cycle-time dashboard should provide actionable operational insights that guide process improvements, rather than acting as a rigid management scorecard. Dashboards should make flow bottlenecks and queue delays visible to the entire team.
An effective cycle-time dashboard brings together several key metrics:
- Median Cycle Time: Tracks the typical end-to-end delivery speed for the current sprint or period.
- P75 and P90 Percentiles: Highlights tail latency and uncovers outlier tasks.
- Historical Trend Lines: Shows whether cycle times are improving, holding steady, or regressing over time.
- Stage-by-Stage Breakdown: Displays the time spent in Development, PR Review, CI/CD, and Deployment.
- Queue Time vs. Active Time: Visualizes how much time changes spend idling versus actively being worked on.
- Active Work in Progress: Displays the number of branches and pull requests currently open.
- Deployment Frequency & Failure Rates: Provides quality context alongside delivery speed.
+-----------------------------------------------------------------------------+
|                      DEVOPS CYCLE TIME DASHBOARD                            |
+-----------------------------------------------------------------------------+
|  [Median: 2.4 Days]     [P90: 6.8 Days]     [WIP: 8 Items]     [CFR: 1.2%]  |
+-----------------------------------------------------------------------------+
|  CYCLE TIME HISTORICAL TREND                                                |
|  [Days]                                                                     |
|   8 |     *                                                                 |
|   4 |    / \     *---*                                                      |
|   2 |---*   \---*     \_______ (P50 Trend Line)                             |
|   0 +----------------------------------------------------> Weeks            |
+-----------------------------------------------------------------------------+
|  STAGE-BY-STAGE TIME BREAKDOWN                                              |
|  Coding:   [======                ] 1.2 Days                                |
|  Review:   [======================] 2.5 Days (Bottleneck Detected)          |
|  CI Build: [=                     ] 0.1 Days                                |
|  Deploy:   [==                    ] 0.2 Days                                |
+-----------------------------------------------------------------------------+
|  RELIABILITY & STABILITY INDICATORS                                         |
|  Deploy Frequency: 4.2 / Day | MTTR: 22 Mins | Build Success Rate: 96.8%    |
+-----------------------------------------------------------------------------+
Teams should review dashboard trends during sprint retrospectives and platform planning sessions. The goal is to encourage collaborative conversations about structural friction, rather than turning the numbers into arbitrary targets.
How to Set a Cycle-Time Baseline
Before setting goals or making major changes to your delivery process, you need to establish an accurate performance baseline. Establishing a baseline provides a clear, data-driven starting point for evaluating future workflow adjustments.
Define Boundaries ───> Collect Data ───> Clean Data ───> Calculate Baselines ───> Improve
To establish an accurate cycle-time baseline, follow these systematic steps:
- Define Measurement Boundaries: Agree on exact starting and ending events (e.g., First Commit to Production Deploy).
- Collect Historical Data: Extract timestamp records across your Git repositories, PR systems, and CI/CD tools over the past 60 to 90 days.
- Clean Inconsistent Records: Filter out orphaned branches, abandoned pull requests, or incorrect administrative updates.
- Calculate Median and Percentiles: Compute your baseline Median, P75, and P90 cycle times across the collected dataset.
- Identify Workflow Bottlenecks: Break the baseline data into individual stages to see where work spends the most time.
- Document Current Workflow: Record your existing development, review, testing, and deployment procedures.
- Introduce One Targeted Improvement: Implement a single, focused change (such as automating a test suite or setting WIP limits).
- Measure and Re-evaluate: Re-measure cycle times over the following month to evaluate the impact of that specific change.
Avoid setting arbitrary reduction targets (such as “cut cycle time by 50% in two weeks”) before you understand your team’s baseline. Effective process improvement is iterative, steady, and grounded in real workflow data.
How to Improve Cycle Time
Improving cycle time requires addressing systemic friction throughout the development lifecycle, rather than asking engineers to write code faster. The focus should be on eliminating unnecessary wait times, automating manual checks, and reducing batch sizes.
Identify Constraint ───> Eliminate Queue ───> Automate Task ───> Re-measure
Practical areas to improve delivery flow include:
- Limit Work in Progress (WIP): Set limits on active tasks per engineer to reduce context switching and speed up code reviews.
- Improve Pull Request Flow: Encourage smaller, focused pull requests and introduce automated notifications to prompt timely reviews.
- Automate Repetitive Tasks: Replace manual build, linting, packaging, and configuration tasks with automated CI/CD jobs.
- Optimize Test Execution: Use test parallelization, smart caching, and targeted test selection to keep pipeline runtimes under 15 minutes.
- Streamline Manual Approvals: Replace manual change approval board (CAB) reviews with automated security scans and policy checks.
- Improve Environment Availability: Provide ephemeral, on-demand testing environments using container platforms to prevent staging queues.
- Reduce Organizational Handoffs: Enable cross-functional teams to test, verify, and deploy their own services independently.
- Standardize Deployment Pipelines: Use reusable pipeline templates and automated blue/green or canary deployment strategies.
- Enhance Observability: Use structured logging, metrics, and tracing to verify production releases quickly without manual sign-offs.
- Remove Redundant Process Steps: Continuously audit your delivery workflow to remove outdated forms, checklists, and sign-offs.
Targeting system-level constraints removes friction across the team, creating a smoother and more sustainable delivery pipeline for everyone.
Common Causes of High Cycle Time
High cycle time is often the result of recurring, well-understood delivery bottlenecks. Recognizing these common failure patterns helps teams diagnose and address process issues quickly.
| Cause | Real-World Example | Recommended Improvement |
| Large Pull Requests | PRs containing 1,500 lines across 30 files sit unreviewed for days | Adopt smaller, logically focused PRs (under 300 lines) |
| Slow Test Suites | Full end-to-end regression tests take 3 hours to finish in CI | Parallelize test execution and separate fast unit tests from deep end-to-end tests |
| Review Queues | PRs wait 48 hours before receiving an initial review | Implement team review rotations and establish WIP limits |
| Manual Deployment | Operations engineers manually SSH into target servers to run release scripts | Implement automated CD pipelines with declarative deployment scripts |
| Environment Shortages | Multiple teams wait in queue to use a single staging server | Provision ephemeral, containerized test environments on demand |
| Excessive WIP | Developers juggle 4 different feature branches simultaneously | Introduce strict WIP limits on the team board |
| Approval Bottlenecks | Changes wait 5 days for a weekly Change Advisory Board (CAB) meeting | Shift to peer reviews and automated policy-as-code guardrails |
| Infrastructure Delays | Teams wait days for new cloud resources to be configured | Provide self-service Infrastructure as Code (IaC) modules |
| Unclear Requirements | Mid-sprint rework caused by incomplete story acceptance criteria | Improve user story refinement and involve engineers early |
Addressing these systemic issues removes process friction, allowing teams to deliver software updates more quickly and reliably.
Common Mistakes When Measuring Cycle Time
Measuring cycle time without clear guidelines can lead to misleading data, unintended consequences, and team frustration. Avoiding common implementation pitfalls ensures that metrics support genuine engineering improvement.
Common Mistakes:
Undefined Boundaries ──> Skewed Averages ──> Individual Blame ──> Gaming the System
Key pitfalls to watch out for include:
- Undefined Start and End Points: Measuring without agreed-upon boundaries creates inconsistent, incomparable data. Always document explicit start and end events.
- Comparing Incompatible Teams: Comparing cycle times across teams working on different architectures (e.g., legacy monoliths vs. modern microservices) creates unfair comparisons. Measure each team against its own historical baseline.
- Relying Exclusively on Averages: Using only arithmetic means hides tail latency and outliers. Use median, P75, and P90 distributions.
- Ignoring Passive Waiting Time: Measuring only active coding time overlooks the queues where code sits idle. Track active work time and queue time separately.
- Ignoring Failed Changes and Hotfixes: Failing to account for rollback and hotfix time paints an incomplete picture of delivery health. Track cycle time alongside Change Failure Rate.
- Neglecting Code Quality: Rushing code through pipelines to lower cycle times leads to technical debt and production bugs. Balance speed with automated quality gates.
- Using Metrics to Rank Developers: Evaluating individual engineers by cycle time encourages rushed reviews, gaming the metrics, and defensive behaviors. Measure system workflows, not people.
- Frequently Changing Measurement Rules: Shifting boundary definitions every few sprints ruins historical trend analysis. Keep measurement rules consistent over time.
- Setting Arbitrary Improvement Targets: Demanding that a team cut cycle time by 50% without addressing root bottlenecks leads to superficial compliance. Focus on removing actual constraints.
Adhering to sound measurement practices ensures your cycle time data remains accurate, actionable, and trusted across the engineering organization.
How to Use Cycle Time Without Blaming Developers
Cycle time should always be used as a tool for evaluating systems, pipelines, and workflows—never for judging or ranking individual developers. When metrics are tied to individual performance evaluations, engineers are incentivized to game the system by artificially slicing work, rushing peer reviews, or avoiding complex tasks.
System-Level Focus (Healthy):
Identify Bottlenecks ───> Automate Pipelines ───> Reduce Wait Times ───> Team Success

Individual Focus (Dysfunctional):
Rank Developers ───> Rushed Reviews ───> Skipped Testing ───> Production Outages
Software delivery is an interdependent, collaborative process. An individual engineer’s cycle time is heavily influenced by factors outside their direct control:
- The responsiveness and availability of peer reviewers
- The speed and reliability of shared CI/CD build runners
- Flaky, slow, or non-deterministic test suites
- External infrastructure dependencies and environment provisioning delays
- The inherent architectural complexity of the legacy codebase
Engineering managers should frame cycle time as a diagnostic tool for team health. Use the data to ask supportive, productive questions during retrospectives: “Where did our pull requests spend the most time waiting this sprint?” or “What tooling can we build to help our automated test suites run faster?”
Focusing on process improvements creates a blameless engineering culture where developers actively use metrics to highlight friction and build better delivery systems.
Real-World DevOps Cycle-Time Example
To see how cycle time measurement works in practice, let us walk through an end-to-end scenario following a single feature change as it moves through a typical delivery pipeline.
[First Commit] ──> [PR Opened] ──> [PR Approved] ──> [CI Passed] ──> [Production Deploy]
    Mon 09:00         Tue 11:00        Wed 15:00        Wed 16:00          Thu 11:00
Code language: CSS (css)
Event Timeline
- Monday, 09:00: An engineer creates a feature branch and pushes the first commit (Cycle Start).
- Tuesday, 11:00: Active coding finishes; the engineer opens a pull request for peer review.
- Wednesday, 10:00: A teammate picks up the pull request and leaves review feedback.
- Wednesday, 14:00: The author addresses the feedback and pushes an updated commit.
- Wednesday, 15:00: The reviewer approves the pull request, and it is merged into the main trunk.
- Wednesday, 16:00: Automated CI build, unit tests, and security scans pass successfully.
- Thursday, 11:00: The change is deployed to production via the scheduled deployment pipeline (Cycle End).
Cycle Time Calculation
$$\text{Total Elapsed Cycle Time} = \text{Thursday 11:00} – \text{Monday 09:00} = 74\text{ hours (3.08 days)}$$
Stage Breakdown
- Active Development: 26 hours (Monday 09:00 to Tuesday 11:00)
- Review Queue Wait (Idle): 23 hours (Tuesday 11:00 to Wednesday 10:00)
- Review Iteration & Approval: 5 hours (Wednesday 10:00 to Wednesday 15:00)
- Automated CI/CD Pipeline: 1 hour (Wednesday 15:00 to Wednesday 16:00)
- Pre-Deployment Release Queue (Idle): 19 hours (Wednesday 16:00 to Thursday 11:00)
Bottleneck Analysis and Improvement
In this scenario, active engineering work accounted for only 32 hours (43% of total time), while idle queues accounted for 42 hours (57% of total time).
The two largest bottlenecks were the 23-hour review pickup delay and the 19-hour pre-deployment release queue. To address these issues, the team could introduce automated Slack review reminders to speed up initial reviews and transition from batched morning deployments to continuous, automated deployments on merge.
Practical Cycle-Time Measurement Workflow
Implementing a sustainable cycle time measurement program involves a clear, sequential process. Following a structured workflow ensures your metrics remain consistent, reliable, and actionable over time.
Define Scope
     ↓
Choose Start Event
     ↓
Choose End Event
     ↓
Collect Timestamps
     ↓
Calculate Cycle Time
     ↓
Analyze Distribution
     ↓
Break Down Stages
     ↓
Find Bottlenecks
     ↓
Improve Workflow
     ↓
Measure Again
Code language: PHP (php)- Define Scope: Identify the specific services, repositories, and engineering teams included in the measurement initiative.
- Choose Start Event: Explicitly document the event that marks the start of technical work (e.g., First Git Commit).
- Choose End Event: Document the completion event that marks successful delivery (e.g., Production Deployment).
- Collect Timestamps: Set up automated integrations with Git, pull request platforms, and CI/CD tools to collect reliable event timestamps.
- Calculate Cycle Time: Apply automated scripts or dashboard tools to calculate elapsed duration for every completed change.
- Analyze Distribution: Plot the data on histograms to evaluate the Median, P75, and P90 percentiles.
- Break Down Stages: Divide overall duration into discrete sub-stages (Coding, Review, CI, Deployment) to isolate delays.
- Find Bottlenecks: Identify the stage where changes spend the highest proportion of idle queue time.
- Improve Workflow: Implement targeted technical and process changes (such as smaller PRs, test parallelization, or WIP limits).
- Measure Again: Track cycle-time trends over subsequent sprints to validate the impact of your improvements.
Cycle-Time Measurement Checklist
Use this practical checklist to guide the design, rollout, and ongoing management of your cycle-time measurement program:
- Define what cycle time means for the team and document agreed-upon terminology
- Define the explicit technical start event (e.g., branch creation, first commit, or PR open)
- Define the explicit technical end event (e.g., merge, staging deploy, or production release)
- Document the calculation method (including how weekends, holidays, and working hours are handled)
- Identify and integrate automated data sources (Git, PR platform, CI/CD runners, release tools)
- Collect reliable, machine-generated timestamps rather than manual developer logs
- Account for passive waiting time separately from active development time
- Calculate median cycle time as the primary indicator for typical delivery speed
- Calculate P75 and P90 percentiles to identify tail latency and workflow unpredictability
- Review the cycle-time distribution visually using histograms or scatter plots
- Break down the delivery lifecycle into clear sub-stages (Development, Review, CI, Deployment)
- Identify the primary workflow bottleneck where work spends the most idle time
- Track work in progress (WIP) alongside cycle time to monitor system load
- Compare cycle time against quality metrics (Change Failure Rate, MTTR, Defect Escape Rate)
- Establish a historical baseline before setting improvement goals
- Implement targeted, incremental improvements rather than sweeping process overhauls
- Review cycle-time trends regularly during team retrospectives and planning sessions
- Avoid using cycle time to rank, evaluate, or compare individual developers
- Keep measurement boundaries and calculation rules consistent over time
DevOps Cycle-Time Learning Roadmap
Mastering delivery metrics requires a solid understanding of modern software delivery architectures, tooling, and operational practices. This learning roadmap outlines the key concepts and skills needed to design, measure, and optimize engineering workflows.
DevOps Fundamentals
        ↓
Software Delivery Lifecycle
        ↓
Git & Branching Strategies
        ↓
Pull Requests & Code Reviews
        ↓
CI/CD Pipelines
        ↓
Automated Testing Strategies
        ↓
Deployment & Release Automation
        ↓
Observability & Telemetry
        ↓
DevOps Metrics (DORA & Flow)
        ↓
Cycle-Time Analysis
        ↓
Value Stream Mapping
        ↓
Continuous Process Improvement
- DevOps Fundamentals: Core principles of collaboration, continuous delivery, and shared responsibility.
- Software Delivery Lifecycle: Understanding how requirements transition through design, coding, testing, and operations.
- Git & Branching Strategies: Mastering branch lifecycle management, Trunk-Based Development, and commit logging.
- Pull Requests & Code Reviews: Designing collaborative review workflows and managing notification routing.
- CI/CD Pipelines: Building automated pipelines using modern tools (GitHub Actions, GitLab CI, Jenkins, ArgoCD).
- Automated Testing Strategies: Implementing fast unit tests, integration testing, and parallel test execution.
- Deployment & Release Automation: Blue/green deployments, canary rollouts, and feature flag management.
- Observability & Telemetry: Instrumenting pipelines and runtime environments to capture operational events and logs.
- DevOps Metrics (DORA & Flow): Understanding Deployment Frequency, Lead Time, Change Failure Rate, MTTR, and Flow Efficiency.
- Cycle-Time Analysis: Applying statistical techniques (median, percentiles, distribution plots) to delivery data.
- Value Stream Mapping: Mapping end-to-end value streams to visualize handoffs, queues, and process waste.
- Continuous Process Improvement: Designing iterative feedback loops to systematically remove pipeline constraints.
Career Value of DevOps Metrics Skills
As software organizations mature, engineering leaders increasingly value professionals who understand how to measure, optimize, and scale delivery systems. Metrics literacy bridges the gap between low-level technical implementation and high-level business delivery.
| Role | How Cycle-Time Knowledge Helps |
| DevOps Engineer | Identifies pipeline bottlenecks, optimizes CI/CD runner speed, and automates manual deployment steps. |
| Site Reliability Engineer (SRE) | Balances delivery speed with system reliability, ensuring rapid releases do not compromise error budgets. |
| Engineering Manager | Uncovers team-level process friction, justifies tooling investments, and runs blameless, data-driven retrospectives. |
| Platform Engineer | Designs internal developer platforms (IDPs) that eliminate queues, automate provisioning, and streamline workflows. |
| DevOps Consultant | Audits client delivery processes, identifies organizational bottlenecks, and builds continuous improvement roadmaps. |
| Delivery Lead | Improves release predictability, manages team WIP, and aligns sprint goals with real-world delivery capacity. |
| Technical Architect | Designs decoupled, modular architectures that reduce cross-team dependencies and branch integration friction. |
Developing expertise in delivery metrics equips technical professionals to make informed architectural, process, and tooling decisions. It elevates an engineer from simply managing tools to actively improving how entire organizations deliver value.
Frequently Asked Questions
What is cycle time in DevOps?
Cycle time in DevOps measures the total elapsed time between a defined starting point (such as the first commit or opening a pull request) and a defined completion point (such as production deployment) within a software delivery workflow. It quantifies how quickly technical work moves through development, review, testing, and deployment.
How is cycle time calculated?
Cycle time is calculated by subtracting the start timestamp from the end timestamp for a specific work item:
$$\text{Cycle Time} = \text{End Timestamp} – \text{Start Timestamp}$$
Teams should decide whether to calculate elapsed time in calendar hours or business hours and apply that rule consistently.
What is the difference between cycle time and lead time?
Cycle time measures the time spent moving work through the technical delivery process (from first commit/PR to deployment). Lead time measures the broader end-to-end journey—from the moment an idea or ticket is created in the product backlog until it is delivered to end users in production.
Where should cycle time start?
Cycle time typically starts at the first commit on a feature branch, branch creation, or when a pull request is officially opened. The chosen start point should reflect the beginning of the technical workflow your team intends to measure and improve.
Where should cycle time end?
Cycle time typically ends when the code change is successfully deployed to a production environment. Some teams may define intermediate completion boundaries, such as merging into the main trunk or deploying to a staging environment, depending on their focus.
Should cycle time include waiting time?
Yes. Total cycle time should include both active working time and passive queue time. Idle periods—such as waiting for peer reviews, build runners, or deployment windows—often represent the largest source of delivery delays and highlight important optimization opportunities.
Why is median cycle time useful?
Median cycle time represents the 50th percentile of your delivery data, showing the duration of a typical change. Unlike the arithmetic mean (average), the median is not distorted by extreme outliers, such as abandoned branches or long-dormant tickets.
What are P75 and P90 cycle times?
P75 and P90 represent the 75th and 90th percentiles of your cycle-time distribution. A P90 of 6 days means that 90% of all changes completed within 6 days, while the remaining 10% took longer. These percentiles help teams monitor tail latency, unpredictability, and edge-case friction.
How can Git and CI/CD help measure cycle time?
Git repositories and CI/CD platforms automatically capture machine-generated timestamps for commits, branch creations, pull request updates, approvals, merges, test runs, and deployments. Extracting this data allows teams to track cycle time accurately without relying on manual logs.
How can teams reduce cycle time?
Teams can lower cycle time by keeping pull requests small, setting limits on Work in Progress (WIP), automating CI/CD testing, parallelizing slow test suites, eliminating manual change approval gates, and providing on-demand testing environments.
Should cycle time be used to measure individual developer productivity?
No. Cycle time is a system and workflow metric, not an individual performance scorecard. Using cycle time to evaluate individual engineers encourages rushed reviews, metric gaming, and cutting corners on testing. It should be used collaboratively to identify systemic bottlenecks.
Which DevOps metrics should be measured alongside cycle time?
Cycle time should be tracked alongside Deployment Frequency, Lead Time for Changes, Change Failure Rate, Mean Time to Restore (MTTR), and Defect Escape Rate. This ensures that gains in delivery speed do not come at the expense of system stability and software quality.
Final Thoughts
Measuring cycle time gives DevOps teams clear visibility into how work moves through their software delivery pipelines. The objective is not simply to chase a lower number at all costs, but to uncover idle queues, review delays, fragile testing steps, manual approvals, and workflow constraints while maintaining software quality, system reliability, and customer value. Engineering organizations that track cycle time responsibly build predictable, sustainable delivery systems that support developer productivity and continuous improvement.

Find Trusted Cardiac Hospitals
Compare heart hospitals by city and services — all in one place.
Explore Hospitals