
Introduction
In the world of distributed systems and cloud infrastructure, outages are an inevitable reality. Whether it is a misconfigured load balancer, a memory leak in a microservice, or a database deadlock, production incidents will occur. The true measure of a mature engineering team is not how often they encounter failure, but how quickly they return to normal operations when things go wrong.
When systems go down, the impact is rarely just technical. It translates directly into lost revenue, diminished customer trust, and increased pressure on engineering teams. This is why Site Reliability Engineering (SRE) and DevOps practices place such high emphasis on observability and rapid response. To manage this effectively, engineers rely on core performance metrics. Among these, Mean Time To Recover (MTTR) stands out as the most critical indicator of organizational resilience.
At DevOpsSchool, we emphasize that understanding MTTR is the first step toward building truly reliable systems. In this guide, we will explore why this metric is vital, how to calculate it, and, most importantly, how to systematically reduce it through automation and better engineering practices.
What Is MTTR (Mean Time To Recover)?
Mean Time To Recover (MTTR) is a maintenance metric that measures the average time required to troubleshoot and restore a system to a fully functional state following a failure. In the context of software and infrastructure, “recovery” means that the services, applications, or servers are back to their expected service level or functional state.
Think of MTTR not just as a timer, but as a reflection of your team’s capability to handle chaos. It begins the moment an incident is identified and ends when the service is fully restored for the user. It does not measure the time spent investigating the root cause after the service is stable; it measures the time from “we are down” to “we are back up.”
Why MTTR Is Important in DevOps and SRE
For an enterprise, downtime is the enemy of growth. MTTR is essential for three primary reasons:
- Customer Experience: Users expect 24/7 availability. A high MTTR means longer periods of broken functionality, which pushes users toward competitors.
- Business Continuity: Service Level Agreements (SLAs) often mandate specific uptime percentages. High MTTR directly leads to SLA violations, financial penalties, and contractual risks.
- Engineering Productivity: When MTTR is high, teams spend excessive time in “firefighting” mode rather than building new features. By lowering MTTR, organizations recover their most valuable asset: time.
MTTR Formula and Calculation
Calculating MTTR is straightforward, but it requires accurate incident tracking.
The Formula
$$MTTR = \frac{\text{Total Downtime}}{\text{Number of Incidents}}$$
Calculation Example
Imagine your e-commerce platform experienced three separate incidents in one month:
- Incident 1: 40 minutes of downtime
- Incident 2: 20 minutes of downtime
- Incident 3: 60 minutes of downtime
Total Downtime = 120 minutes
Number of Incidents = 3
$$MTTR = \frac{120 \text{ minutes}}{3 \text{ incidents}} = 40 \text{ minutes}$$
This means, on average, your team takes 40 minutes to get the system back online once an incident begins.
MTTR vs. MTTD vs. MTBF
Understanding the relationship between these metrics is crucial for a complete view of reliability.
| Metric | Full Name | Focus Area |
| MTTD | Mean Time To Detect | The time between the start of an incident and when it is identified by the team. |
| MTTR | Mean Time To Recover | The time taken to restore the system after the incident is detected. |
| MTBF | Mean Time Between Failures | The average time elapsed between one system breakdown and the next. |
While MTTD focuses on the effectiveness of your monitoring and alerting, MTTR focuses on the efficiency of your operational processes and automation.
What Impacts MTTR in Real Systems?
Several factors often inflate MTTR, turning minor glitches into major outages:
- Alert Fatigue: If engineers receive hundreds of low-priority alerts, they may ignore or delay responding to a critical one.
- Siloed Knowledge: When only one person knows how to fix a specific service, the recovery time is dependent on their availability.
- Manual Processes: Relying on manual SSH access and script execution is slow and error-prone compared to automated deployment pipelines.
- Lack of Documentation: Without clear runbooks, engineers spend time guessing how to resolve an issue rather than executing a proven fix.
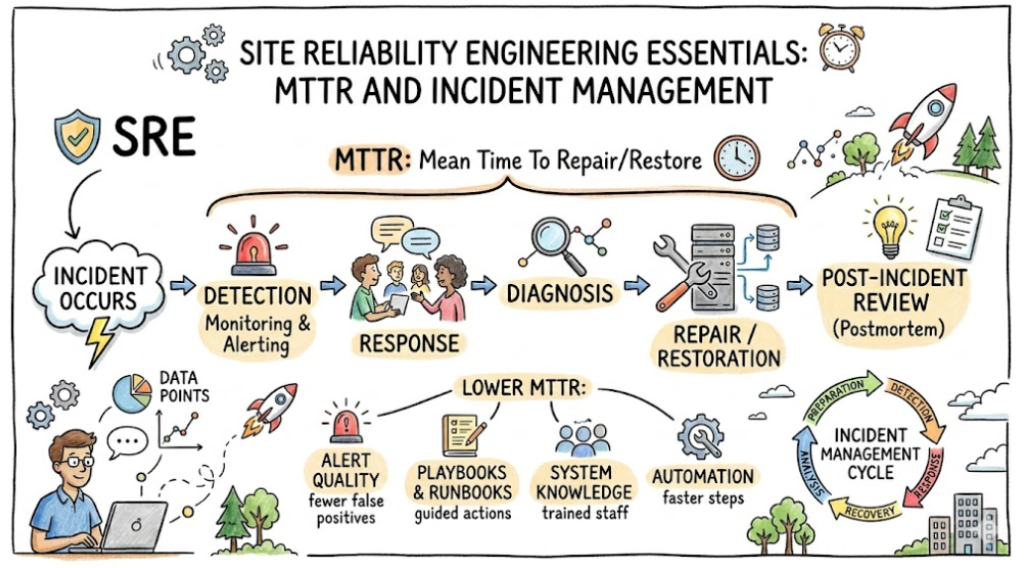
Typical Incident Lifecycle and MTTR
- Incident Occurs: The failure happens (e.g., a database connection pool is exhausted).
- Detection: Monitoring tools (like Prometheus) trigger an alert.
- Acknowledgement: An engineer notices the alert and begins investigation.
- Diagnosis: The engineer identifies the root cause using logs and traces.
- Resolution: A fix is deployed (e.g., a rollback, a configuration change, or a restart).
- Recovery: The system returns to normal operation.
MTTR covers the duration from Step 2 to Step 6.
How Engineers Reduce MTTR
To lower MTTR, teams must shift from manual reaction to proactive orchestration:
- Implement Proactive Monitoring: Use dashboards that visualize health at a glance.
- Standardize Runbooks: Maintain updated, step-by-step guides for common failure modes.
- Automate Rollbacks: If a new release causes an error, a “one-click” rollback to the previous stable version is the fastest way to recover.
- Incident Drills: Conduct “Game Days” or chaos engineering experiments to practice recovery under pressure.
Role of Observability in Reducing MTTR
Observability is the “eyes and ears” of the SRE. It allows you to see inside your services.
- Metrics (Prometheus): Provide the “what”—the CPU is high, or the error rate is spiking.
- Logs (ELK Stack): Provide the “why”—the specific error message in the application code.
- Traces (OpenTelemetry): Provide the “where”—identifying exactly which microservice in a chain is causing the latency.
When these three pillars are integrated, engineers can move from “something is wrong” to “this specific line of code is failing” in seconds.
Automation Strategies to Improve MTTR
Automation is the biggest lever in reducing MTTR.
- Auto-healing: Configure Kubernetes to automatically restart crashed pods or replace unhealthy nodes without human intervention.
- Automated Incident Response: Use tools that automatically trigger Slack alerts, page the on-call engineer, and open a ticket with all relevant diagnostic data attached.
- CI/CD Pipeline Security: Ensure that your deployment pipelines include automated health checks that prevent faulty code from reaching production.
Real-World Example: High vs. Low MTTR
High MTTR Incident
An application crashes. The monitoring system is not configured correctly, so nobody notices for an hour. Once notified, the team manually searches through server logs for 30 minutes to find the error. They then spend another hour troubleshooting permissions to restart the service.
Total MTTR: 2.5 hours.
Low MTTR Incident
The same application crashes. An automated alert fires immediately. The system triggers a self-healing script that restarts the container. An SRE is notified via a ticket that includes a link to the relevant logs. The service recovers in 3 minutes.
Total MTTR: 3 minutes.
Best Practices to Reduce MTTR
- Establish a “Blame-Free” Culture: Focus on fixing the process, not blaming individuals.
- Keep Documentation Updated: If a runbook is outdated, it is worse than having no documentation at all.
- Invest in Tooling: Use modern incident management platforms to coordinate communication.
- Continuous Learning: Always conduct a post-mortem analysis after an incident to identify how the next one can be resolved even faster.
Common Mistakes That Increase MTTR
- Over-reliance on Manual Intervention: Assuming a human is always needed to fix a problem.
- Ignoring Technical Debt: Allowing fragile code to stay in production increases the frequency and complexity of failures.
- Poor Communication: Siloed teams lead to fragmented incident response, where the database team and app team are not talking to each other.
Tools That Help Improve MTTR
Modern engineering teams typically use a combination of these tools:
- Monitoring/Metrics: Prometheus, Grafana, Datadog.
- Logging: ELK Stack (Elasticsearch, Logstash, Kibana), Splunk.
- Incident Management: PagerDuty, Opsgenie, VictorOps.
- Automation: Terraform, Ansible, Kubernetes.
MTTR in Cloud-Native Systems
In microservices architectures, MTTR is more complex because one failure often triggers a cascade. Kubernetes excels here; its ability to perform rolling updates and self-healing deployments means that, in many cases, the system recovers itself before a human ever sees an alert. Distributed tracing becomes essential here to identify which microservice is the “weak link” in the chain.
Business Impact of MTTR
MTTR is a financial metric. Every minute of downtime costs money in lost transactions, productivity loss, and potential customer churn. For SaaS companies, high MTTR is a direct contributor to lower Customer Lifetime Value (CLV). Conversely, teams that maintain a low MTTR build a reputation for reliability that becomes a competitive advantage.
Role of DevOps and SRE in MTTR Optimization
DevOps is about shared responsibility. SRE teams provide the framework, but developers must write code that is observable and resilient. At DevOpsSchool, we advocate for a culture where “you build it, you run it.” When developers are involved in incident resolution, they naturally write better, more maintainable code, which reduces the frequency of incidents and improves MTTR.
Career Importance of MTTR Knowledge
Professionals who can demonstrate an ability to lower MTTR are highly sought after. Whether you are a Cloud Engineer, DevOps Engineer, or SRE, mastering incident management and observability shows that you can handle the high-pressure demands of modern enterprise environments. It is a defining skill for those moving into senior or staff engineering roles.
FAQs
- What is MTTR in DevOps? It is the average time to restore a system after an incident occurs.
- Why is MTTR important? It directly impacts system availability, customer trust, and operational costs.
- Is lower MTTR better? Yes, lower MTTR indicates faster recovery and higher system resilience.
- How do you calculate MTTR? Divide the total downtime by the number of incidents.
- What is the difference between MTTR and MTTD? MTTD is time to detect; MTTR is time to recover.
- How can automation reduce MTTR? By removing manual steps, enabling auto-healing, and automating rollbacks.
- What tools help reduce MTTR? Monitoring tools like Prometheus, alerting tools like PagerDuty, and automation tools like Kubernetes.
- What is a good MTTR value? There is no universal number; it depends on your industry, but “as low as possible” is the goal.
- Does MTTR include root cause analysis? No, it usually ends when the service is restored.
- Can MTTR be zero? Theoretically, yes, through perfect automation, but practically, it is always greater than zero.
- How do I start improving MTTR? Begin by instrumenting your applications with better logging and metrics.
- Is MTTR just for SREs? No, it is a shared responsibility for all engineers involved in the service lifecycle.
- Why do manual processes increase MTTR? Humans are slow, prone to errors, and can’t always respond instantly.
- What is an incident drill? A practice session to simulate an outage and test response procedures.
- How does observability help? It provides the data needed to diagnose and fix problems faster.
Final Thoughts
MTTR is more than just a metric on a dashboard; it is a pulse check for your engineering organization. It tells you how healthy your processes are and how well your team can handle the inevitable challenges of production environments. By focusing on observability, automation, and a culture of continuous improvement, you can transform your incident response from a chaotic scramble into a streamlined, efficient process.
Remember, the goal is not to eliminate all incidents—that is an impossible task in complex systems. The goal is to build systems that can withstand failure and recover gracefully. Continue learning, refining your runbooks, and automating the mundane. For those looking to deepen their expertise in incident management and reliability engineering, DevOpsSchool provides resources to help you master these critical concepts.

Find Trusted Cardiac Hospitals
Compare heart hospitals by city and services — all in one place.
Explore Hospitals