
Introduction
Modern IT environments are no longer simple. Most organizations today run a mix of cloud platforms, on-prem infrastructure, SaaS tools, containers, microservices, networks, and security systems. Each layer generates its own metrics, logs, alerts, and events—often spread across dozens of tools. This fragmentation creates blind spots, slows down troubleshooting, and increases operational risk.
Single Pane of Glass (SPoG) IT Dashboards solve this problem by bringing all critical IT data into one unified, real-time view. Instead of switching between monitoring, logging, ticketing, and security tools, teams gain a centralized dashboard that shows system health, performance, availability, and risks at a glance.
These dashboards are essential for:
- Faster incident detection and resolution
- Better collaboration across IT, DevOps, SRE, and security teams
- Improved visibility for leadership and business stakeholders
When choosing a Single Pane of Glass IT Dashboard, buyers should evaluate integration depth, usability, scalability, security, performance, and total cost of ownership—not just visual appeal.
Best for:
Organizations with complex IT environments—mid-market to enterprise—such as SaaS companies, financial services, healthcare providers, telecom operators, and global enterprises with distributed infrastructure.
Not ideal for:
Very small teams or startups with minimal infrastructure, where a single monitoring tool or basic dashboards may be sufficient and more cost-effective.
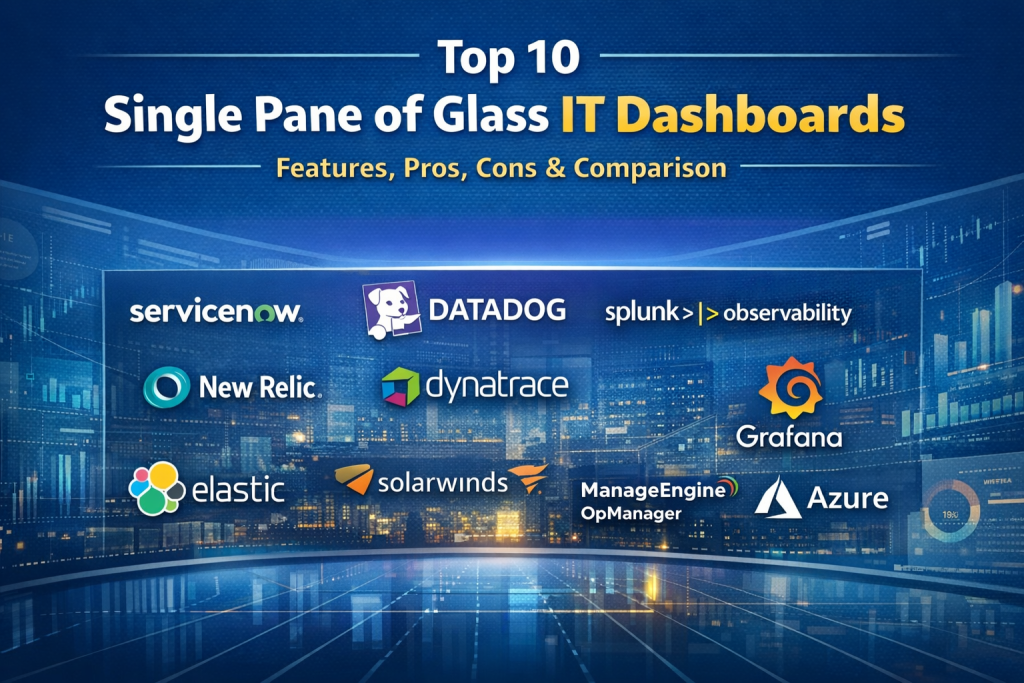
Top 10 Single Pane of Glass IT Dashboards Tools
1 — ServiceNow IT Operations Management
Short description:
An enterprise-grade Single Pane of Glass platform that unifies IT operations, incidents, assets, and workflows across large organizations.
Key features:
- Centralized IT health dashboards across infrastructure and applications
- Native incident, problem, and change management
- Automated event correlation and root cause analysis
- CMDB-driven dependency mapping
- AI-powered operational insights
- Custom executive and operational dashboards
Pros:
- Extremely powerful for large, complex IT environments
- Deep workflow automation and governance
Cons:
- High cost and long implementation cycles
- Requires skilled administrators
Security & compliance:
SSO, role-based access, encryption, audit logs, SOC 2, ISO 27001, GDPR, HIPAA (configurable)
Support & community:
Strong enterprise support, extensive documentation, large partner ecosystem
2 — Datadog
Short description:
A cloud-native observability platform providing a unified view of infrastructure, applications, logs, and security.
Key features:
- Unified dashboards for metrics, logs, and traces
- Real-time alerting and anomaly detection
- Cloud, container, and Kubernetes visibility
- Application performance monitoring
- Security and compliance monitoring
- Customizable visual dashboards
Pros:
- Fast deployment and intuitive UI
- Excellent cloud and DevOps integrations
Cons:
- Can become expensive at scale
- Advanced features require configuration expertise
Security & compliance:
SSO, encryption, audit logs, SOC 2, ISO, GDPR
Support & community:
High-quality documentation, active community, enterprise support options
3 — Splunk Observability Cloud
Short description:
A data-driven platform that consolidates logs, metrics, and traces into a single operational view.
Key features:
- Unified observability dashboards
- Powerful log analytics and search
- AI-assisted anomaly detection
- Real-time incident insights
- Scalable data ingestion
- Custom reporting and visualizations
Pros:
- Industry-leading analytics capabilities
- Excellent for compliance and forensics
Cons:
- Steep learning curve
- Licensing can be complex
Security & compliance:
SSO, encryption, audit trails, SOC 2, ISO, GDPR
Support & community:
Strong enterprise support, large global user community
4 — Grafana Enterprise
Short description:
A highly flexible visualization platform used to build a centralized view across diverse monitoring data sources.
Key features:
- Custom dashboards from multiple data sources
- Real-time visualization and alerts
- Plug-in ecosystem for integrations
- Advanced query and panel customization
- Enterprise reporting and access controls
Pros:
- Extremely customizable
- Strong open-source foundation
Cons:
- Requires setup and maintenance
- Native alerting less advanced than competitors
Security & compliance:
SSO, RBAC, encryption (enterprise features)
Support & community:
Large open-source community, paid enterprise support available
5 — New Relic One
Short description:
An observability platform designed to unify application, infrastructure, and user experience data.
Key features:
- Unified entity-centric dashboards
- Full-stack observability
- Real-time alerting and error tracking
- Business and technical metrics correlation
- Cloud-native scalability
Pros:
- Clean, modern interface
- Strong APM capabilities
Cons:
- Pricing complexity
- Less customizable dashboards than some rivals
Security & compliance:
SSO, encryption, SOC 2, GDPR
Support & community:
Good documentation, responsive support tiers
6 — Dynatrace
Short description:
An AI-driven platform providing automated insights and a unified operational view across environments.
Key features:
- Automatic topology discovery
- AI-powered root cause analysis
- End-to-end service visibility
- Unified dashboards for ops and business
- Real-time performance analytics
Pros:
- Minimal manual configuration
- Excellent automation and intelligence
Cons:
- Premium pricing
- Less control for manual tuning
Security & compliance:
SSO, encryption, audit logs, SOC 2, ISO, GDPR
Support & community:
Enterprise-focused support, training resources
7 — Elastic Observability
Short description:
A flexible Single Pane of Glass solution built on search-driven analytics for logs, metrics, and traces.
Key features:
- Unified dashboards across observability data
- Real-time search and correlation
- Scalable data ingestion
- Custom visualizations
- Integration with security analytics
Pros:
- Highly flexible and scalable
- Strong analytics capabilities
Cons:
- Requires tuning and management
- UI complexity for beginners
Security & compliance:
SSO, encryption, audit logs, GDPR, SOC 2
Support & community:
Large developer community, enterprise support available
8 — SolarWinds Hybrid Cloud Observability
Short description:
A traditional IT monitoring platform evolving into a unified hybrid visibility dashboard.
Key features:
- Infrastructure and network visibility
- Centralized health dashboards
- Application and database monitoring
- Alerting and reporting
- Hybrid environment support
Pros:
- Strong network monitoring heritage
- Suitable for on-prem environments
Cons:
- UI feels dated
- Limited cloud-native depth
Security & compliance:
SSO, encryption, audit logs (varies by module)
Support & community:
Established support channels, moderate community
9 — ManageEngine OpManager Plus
Short description:
An integrated IT operations dashboard for unified monitoring and management.
Key features:
- Infrastructure and network dashboards
- Integrated fault and performance monitoring
- Centralized alerts and reporting
- Custom views for operations teams
- Cost-effective licensing
Pros:
- Affordable for mid-market
- Broad IT coverage
Cons:
- Less advanced analytics
- UI can feel cluttered
Security & compliance:
SSO, RBAC, encryption (varies by deployment)
Support & community:
Good documentation, responsive vendor support
10 — Azure Monitor
Short description:
A cloud-native dashboard solution for unified visibility across Microsoft-centric environments.
Key features:
- Unified metrics, logs, and alerts
- Native cloud integration
- Custom dashboards and workbooks
- Application insights
- Automated alerts and scaling
Pros:
- Seamless integration with cloud workloads
- Scales easily
Cons:
- Best suited for single-cloud users
- Limited multi-cloud depth
Security & compliance:
SSO, encryption, audit logs, SOC 2, ISO, GDPR
Support & community:
Strong enterprise support, large ecosystem
Comparison Table
| Tool Name | Best For | Platform(s) Supported | Standout Feature | Rating |
|---|---|---|---|---|
| ServiceNow ITOM | Large enterprises | Cloud & on-prem | Workflow + CMDB visibility | N/A |
| Datadog | Cloud-native teams | Multi-cloud | Unified observability | N/A |
| Splunk Observability | Data-driven ops | Cloud & hybrid | Advanced analytics | N/A |
| Grafana Enterprise | Custom dashboards | Multi-platform | Extreme flexibility | N/A |
| New Relic One | Application teams | Cloud | Full-stack observability | N/A |
| Dynatrace | Automated operations | Cloud & hybrid | AI-driven RCA | N/A |
| Elastic Observability | Log-heavy environments | Multi-platform | Search-first insights | N/A |
| SolarWinds | Hybrid IT | On-prem & hybrid | Network visibility | N/A |
| ManageEngine | Mid-market IT | On-prem & hybrid | Cost-effective SPoG | N/A |
| Azure Monitor | Microsoft ecosystems | Cloud | Native cloud integration | N/A |
Evaluation & Scoring of Single Pane of Glass IT Dashboards
| Criteria | Weight | Score Considerations |
|---|---|---|
| Core features | 25% | Coverage, analytics depth |
| Ease of use | 15% | UI, onboarding |
| Integrations & ecosystem | 15% | Tool compatibility |
| Security & compliance | 10% | Controls, certifications |
| Performance & reliability | 10% | Scalability, uptime |
| Support & community | 10% | Documentation, SLAs |
| Price / value | 15% | ROI and flexibility |
Which Single Pane of Glass IT Dashboards Tool Is Right for You?
- Solo users & small teams: Lightweight dashboards or cloud-native tools
- SMBs: Cost-effective platforms with broad visibility
- Mid-market: Balanced tools with automation and integrations
- Enterprise: Workflow-driven, AI-powered platforms
Choose based on integration depth, scalability, security requirements, and long-term cost, not just features.
Frequently Asked Questions (FAQs)
- What does “Single Pane of Glass” mean in IT?
A unified dashboard showing all critical IT data in one view. - Are SPoG dashboards only for large enterprises?
No, but enterprises benefit most due to complexity. - Do these tools replace monitoring systems?
They usually integrate and unify existing tools. - How long does implementation take?
From hours for cloud tools to months for enterprise platforms. - Are these dashboards customizable?
Yes, most allow deep customization. - Do they support multi-cloud environments?
Many do, but depth varies. - Are SPoG tools secure?
Most offer enterprise-grade security controls. - What teams use these dashboards?
IT Ops, DevOps, SRE, Security, and leadership. - Are open-source options viable?
Yes, but they require management effort. - What is the biggest mistake buyers make?
Choosing based on visuals instead of integration depth.
Conclusion
Single Pane of Glass IT Dashboards are no longer optional—they are essential for managing modern, distributed IT environments. The right tool improves visibility, reduces downtime, and aligns IT operations with business outcomes.
There is no universal best solution. The ideal platform depends on organization size, technical maturity, budget, and integration needs. By focusing on visibility, usability, security, and long-term scalability, teams can select a dashboard that truly simplifies complexity and drives operational excellence.

Find Trusted Cardiac Hospitals
Compare heart hospitals by city and services — all in one place.
Explore Hospitals
Single-pane-of-glass IT dashboards bring data from multiple systems into one centralized view, helping IT teams monitor infrastructure, applications, and services more efficiently. When comparing these tools, I would focus on real-time monitoring, data integration, customizable dashboards, alert management, visualization options, and reporting capabilities. These features can reduce the need to switch between multiple platforms, improve issue detection, and support faster troubleshooting. The right dashboard should provide clear visibility, reliable data, and smooth integration with existing IT tools.
A single-pane-of-glass IT dashboard is useful when teams need to understand the health of different systems without switching between multiple monitoring tools. I would compare platforms based on data source integrations, dashboard customization, alert correlation, role-based views, and real-time updates. The ability to connect infrastructure metrics, application logs, network events, and service status can make troubleshooting more focused. It is also worth checking data refresh speed, permission controls, dashboard loading performance, and whether the platform helps teams identify related incidents instead of simply displaying separate alerts.
The primary danger of unified dashboards is aggregating too much uncurated telemetry into cluttered screens nobody uses during an outage. Designing dashboards tailored to specific operational personas ensures incident responders see immediate service-level health indicators without digging through uncurated metrics.
Single pane of glass dashboards promise unified visibility across IT, and this article explains both the appeal and the challenge. What stands out to me is the caution about data overload, because cramming everything into one view creates confusion. One suggestion is to design dashboards around user roles and questions, since a NOC engineer and an executive need different panes. Clarity beats completeness. Balanced and practical read.
A single-pane-of-glass dashboard helps IT teams monitor different systems from one place instead of switching between multiple tools. Having clear alerts, real-time data, and useful integrations can make daily monitoring much easier. I think customizable views are also important so teams can focus on the information that matters most. The right dashboard can improve visibility, save time, and help teams respond to issues faster.
Single-pane-of-glass IT dashboards bring data from multiple systems into one view, helping teams monitor infrastructure and application health. When comparing options, consider data source integration, customizable widgets, real-time alerts, access controls, reporting, and dashboard performance to improve visibility and simplify IT operations.
Single Pane of Glass IT dashboards provide a unified view of an organization’s IT infrastructure, helping teams monitor systems, applications, networks, and services from one centralized interface. Key features such as real-time monitoring, customizable dashboards, alert management, performance analytics, infrastructure visibility, and integration with multiple IT tools are essential when evaluating these solutions. When comparing platforms, organizations should consider data integration capabilities, dashboard customization, scalability, reporting flexibility, security, and ease of use. The right solution can reduce tool switching, simplify troubleshooting, improve operational visibility, and help IT teams make faster, more informed decisions.
Single-pane-of-glass IT dashboards help teams bring information from multiple monitoring systems into one centralized view. Real-time metrics, customizable widgets, alert aggregation, and cross-platform integrations make it easier to identify infrastructure issues and understand overall system health. Designing dashboards around meaningful KPIs and role-specific requirements can reduce information overload and support faster operational decisions.
A central dashboard can create confusion when connected systems use different data formats and naming rules. Even small differences in timestamps or service labels can affect incident analysis. Engineering teams should agree on shared data standards before connecting multiple monitoring sources. They should also check for missing metrics and broken integrations. This keeps dashboard information consistent and helps teams respond with greater confidence.
A single pane of glass dashboard brings key IT data into one view. It can help teams monitor systems, review alerts, and spot service problems faster. But combining every metric on one screen can create clutter. Teams should focus on the information that supports real decisions. Data freshness, role-based views, and links to monitoring tools are also important. A useful dashboard should show the current state and make it easy to investigate issues. The goal is not to display everything, but to help people understand what needs attention first.
A unified dashboard can still mislead engineers when different monitoring systems define the same metric in different ways. For example, two tools may report different availability figures because they use different sampling intervals, error rules, or time windows. Teams should establish shared metric definitions, consistent service identifiers, and clear ownership for each data source before combining dashboards. It is also worth testing how the dashboard behaves when a source becomes unavailable or telemetry arrives late. Showing stale data as current can lead to poor decisions during incidents. Adding data freshness indicators and documenting metric definitions helps teams trust the information they use for troubleshooting and capacity planning.
Unpacking centralized telemetry consoles underscored the dangerous difference between comprehensive observability and visual noise overload. Merging heterogeneous network probes, hypervisor vitals, and cloud billing statistics under unified role-based views guarantees platform teams identify cascading operational bottlenecks rapidly without toggling fragmented, siloed monitoring consoles during active production incidents.
Root cause analysis tools are most useful when they help teams move beyond symptoms and understand why an incident happened. Compare features such as incident timelines, evidence collection, collaboration, monitoring integrations, and corrective action tracking. Linking findings to clear action owners and reviewing recurring incidents can help organizations prevent repeat failures instead of simply fixing the same issues again.
One of the biggest challenges with implementing a single pane of glass isn’t choosing the tool itself, but rather avoiding alert fatigue during data normalization. When you aggregate metrics, logs, and traces from diverse cloud and on-prem layers, defining clear correlation rules early on matters more than the dashboard’s visual appeal. Otherwise, centralized visibility just means a faster way to see noise.
Single-pane-of-glass IT dashboards help teams view infrastructure health, alerts, and performance metrics from multiple systems in one centralized interface. Platforms like Grafana offer customizable dashboards, data source integrations, and alerting features, helping IT professionals spot issues faster, reduce tool switching, and make better operational decisions.
A single-pane dashboard is most useful when it connects related alerts with service dependencies, helping teams identify the root cause instead of chasing symptoms. Prioritizing actionable alerts, role-based views, and clear ownership can also reduce alert fatigue and make incident response more effective.
Really helpful article! I like how you explained the pros and cons of each dashboard tool — it makes comparing options much easier. Having a good single pane of glass can really improve visibility and simplify monitoring across complex environments, especially when teams are dealing with lots of metrics and alerts. I’m curious how others balance the need for customizable views with performance and clarity in real use cases. Overall, this breakdown gives a clear picture and is super useful for anyone exploring dashboard solutions.