What is SAP Lumira?

SAP Lumira is a self-service data visualization and discovery tool developed by SAP. It enables users to analyze and visualize data from various sources, helping organizations gain insights and make informed decisions. SAP Lumira is designed to be user-friendly and intuitive, allowing users to create interactive visualizations without requiring extensive technical expertise.
Top 10 use cases of SAP Lumira:
The following are the top 10 use cases of SAP Lumira:
- Data Visualization: SAP Lumira allows users to create interactive visualizations, charts, graphs, and maps, making it easier to understand complex data patterns and trends.
- Data Exploration: Users can explore data by filtering, drilling down, and applying various interactive features to uncover insights and relationships within their datasets.
- Self-Service Analytics: SAP Lumira empowers business users to perform data analysis and create visualizations without depending on IT departments, enabling quicker decision-making.
- Ad-Hoc Reporting: Users can create on-the-fly reports to address specific business questions, customize views, and share insights with colleagues and stakeholders.
- Data Blending: SAP Lumira supports the blending of data from multiple sources, allowing users to combine disparate datasets for a comprehensive analysis.
- Predictive Analytics: SAP Lumira includes predictive capabilities that enable users to apply statistical algorithms to their data for forecasting, trend analysis, and anomaly detection.
- Dashboard Creation: Users can build interactive dashboards by combining multiple visualizations, filters, and charts into a single view to provide a holistic overview of key metrics.
- Mobile Analytics: SAP Lumira offers mobile accessibility, allowing users to access and interact with visualizations and reports on smartphones and tablets.
- Storytelling: SAP Lumira supports data storytelling, enabling users to create narratives by sequencing visualizations and adding annotations to guide readers through the insights.
- Sales and Marketing Analysis: Organizations can use SAP Lumira to analyze sales data, track customer behavior, evaluate marketing campaigns, and identify areas for growth.
These use cases illustrate the versatility of SAP Lumira in helping organizations extract insights from their data, improve decision-making, and drive business value. It’s important to note that SAP Lumira is part of the broader SAP analytics portfolio, which includes other tools like SAP Analytics Cloud and SAP BusinessObjects, each catering to different aspects of data analysis and reporting.
What are the feature of SAP Lumira?
SAP Lumira is a data visualization and exploration tool that empowers users to analyze, visualize, and gain insights from their data. It offers a range of features to facilitate self-service analytics and reporting. Here are some key features of SAP Lumira:
- Data Connectivity: SAP Lumira supports various data sources, including databases, spreadsheets, cloud services, and big data platforms. Users can connect to and import data from these sources.
- Data Preparation: Users can perform data transformation, cleansing, and enrichment using intuitive interfaces. This includes data cleansing, joining, filtering, and calculations.
- Data Blending: SAP Lumira enables users to blend data from different sources, allowing them to combine datasets and create unified visualizations.
- Data Exploration: Users can explore data through filtering, sorting, drilling down, and applying hierarchies to uncover patterns and insights.
- Visualization Options: SAP Lumira offers a variety of visualization types, such as bar charts, line charts, scatter plots, maps, and more. Users can customize labels, colors, and formatting.
- Predictive Analytics: SAP Lumira supports predictive capabilities, allowing users to apply statistical algorithms to their data for forecasting, trend analysis, and anomaly detection.
- Interactive Dashboards: Users can create interactive dashboards by combining multiple visualizations, charts, and filters into a single view. Interactivity enables dynamic exploration.
- Storyboards: Storyboards enable users to create narratives by sequencing visualizations, adding annotations, and guiding readers through insights in a logical manner.
- Collaboration and Sharing: SAP Lumira allows users to share visualizations, stories, and datasets with colleagues and stakeholders. Shared content can be accessed through the SAP Lumira Viewer or exported as PDF or images.
- Mobile Accessibility: SAP Lumira supports mobile devices, allowing users to access and interact with visualizations and stories on smartphones and tablets.
How SAP Lumira works and Architecture?
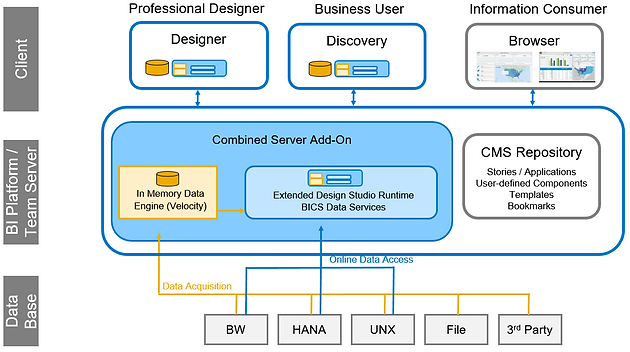
SAP Lumira’s architecture is designed to provide a streamlined experience for data visualization and analysis. Here’s an overview of its architecture:
- Data Sources: SAP Lumira can connect to various data sources, including databases, files, cloud services, and more.
- Data Preparation: Users prepare and cleanse data using the SAP Lumira interface. Data preparation involves data transformation, cleaning, and enrichment.
- Data Discovery: Users explore data by creating visualizations, applying filters, and drilling down into details to uncover insights.
- Data Visualization: The data visualization layer generates visualizations based on user selections and interactions. Visualizations are displayed in the user interface.
- Storyboarding: Users create stories by sequencing visualizations and adding annotations to guide readers through insights in a narrative format.
- Sharing and Collaboration: Visualizations, stories, and datasets can be shared with colleagues and stakeholders. Shared content can be accessed through the SAP Lumira Viewer or exported.
- Mobile Access: SAP Lumira supports mobile devices, allowing users to access visualizations and stories on smartphones and tablets using the SAP Lumira Mobile app.
- Data Connectivity: SAP Lumira connects to various data sources through data connectors, enabling users to access and import data for analysis.
- Backend Services: SAP Lumira interacts with backend services to process user actions, generate visualizations, and handle sharing and collaboration features.
- Security and Authentication: SAP Lumira provides security features to ensure data protection, role-based access, and user authentication.
Overall, SAP Lumira’s architecture aims to provide an intuitive and efficient environment for users to discover insights, create visualizations, and share their findings with others in an organization.
How to Install SAP Lumira?
There are two ways to install SAP Lumira:
- Using the SAP Lumira installer:
- Go to the SAP website and download the SAP Lumira installer for your operating system.
- Run the installer and use the given instructions over the live screen.
- Using the SAP Lumira virtual appliance:
- Go to the SAP website and create a SAP account.
- Subscribe to SAP Lumira.
- Once you have subscribed to SAP Lumira, you will be able to download the SAP Lumira virtual appliance.
Once you have installed SAP Lumira, you can start creating visualizations and dashboards.
Here are the detailed steps on how to install SAP Lumira using the SAP Lumira installer:
- Go to the SAP website and download the SAP Lumira installer for your operating system.
- Run the installer and use the given instructions over the live screen.
- On the first screen, accept the terms of the license agreement and click Next.
- On the second screen, select the installation options that you want and click Next.
- On the third screen, select the folder where you want to install SAP Lumira and click Install.
- The installer will start installing SAP Lumira. This may take a few minutes.
- Once the installation is complete, click Finish.
Once you have installed SAP Lumira, you can start creating visualizations and dashboards.
Here are the detailed steps on how to install SAP Lumira using the SAP Lumira virtual appliance:
- Go to the SAP website and create a SAP account.
- Subscribe to SAP Lumira.
- Once you have subscribed to SAP Lumira, you will be able to download the SAP Lumira virtual appliance.
Once you have downloaded the SAP Lumira virtual appliance, follow these steps to install it:
- Unzip the SAP Lumira virtual appliance file.
- Open the VirtualBox application.
- Click on the File menu and select Import Appliance….
- In the Import Appliance dialog box, select the SAP Lumira virtual appliance file that you unzipped in step 1.
- Click on the Open button.
- The SAP Lumira virtual appliance will be imported into VirtualBox.
- Click on the Start button to start the SAP Lumira virtual appliance.
- The SAP Lumira virtual appliance will start up and you will be prompted to log in.
- Log in using the username and password that you created when you subscribed to SAP Lumira.
- Once you have logged in, you will be able to access SAP Lumira.
Basic Tutorials of SAP Lumira: Getting Started
The following are the basic tutorials of SAP Lumira:
- Getting Started with SAP Lumira: This tutorial shows you how to install SAP Lumira, create a new project, and create a visualization.
- Go to the SAP website and download the SAP Lumira installer for your operating system.
- Run the installer and use the given instructions over the live screen.
- Once you have installed SAP Lumira, open the SAP Lumira Designer application.
- Click on the New button.
- Select the Project option.
- Click on the Create button.
- In the Project Name dialog box, enter your project name and hit on the OK button.
- In the Project Wizard, choose the data source that you want to apply.
- Click on the Next button.
- In the Fields page, select the fields that you want to add to your visualization.
- Click on the Next button.
- In the Visualizations page, add a visualization to your project.
- Click on the Finish button.
- Connecting to Data in SAP Lumira: This tutorial shows you how to connect to different data sources in SAP Lumira.
- SAP Lumira can connect to a wide variety of data sources, including:
- Microsoft Excel spreadsheets
- Microsoft SQL Server databases
- Cloud-based data sources such as Azure Data Lake Storage and Amazon Redshift
- To connect to a data source, you can use the Data Sources dialog box.
- In the Data Sources dialog box, right-click on the Data Sources node and select New Data Source.
- In the New Data Source dialog box, choose the data source type that you like to connect to.
- Enter the connection details.
- Click on the OK button.
- SAP Lumira can connect to a wide variety of data sources, including:
- Creating Visualizations in SAP Lumira: This tutorial shows you how to create different visualizations in SAP Lumira.
- SAP Lumira provides a wide variety of visualizations that you can use to represent your data.
- Some of the visualizations that you can create in SAP Lumira include:
- Bar charts
- Line charts
- Pie charts
- Maps
- To create a visualization, you can use the Visualizations pane.
- In the Visualizations pane, drag and drop the visualization type that you like to create to the Canvas pane.
- You can then configure the visualization.
- Creating Dashboards in SAP Lumira: This tutorial shows you how to create dashboards in SAP Lumira.
- A dashboard is a collection of visualizations that you can use to monitor your data.
- You can create different dashboards for different purposes, such as:
- A dashboard for tracking sales performance
- A dashboard for monitoring customer satisfaction
- A dashboard for tracking inventory levels
- To create a dashboard, you can use the Dashboards pane.
- In the Dashboards pane, drag and drop the visualizations that you like to include in the dashboard to the Canvas pane.
- You can then configure the dashboard.

👤 About the Author
Ashwani is passionate about DevOps, DevSecOps, SRE, MLOps, and AiOps, with a strong drive to simplify and scale modern IT operations. Through continuous learning and sharing, Ashwani helps organizations and engineers adopt best practices for automation, security, reliability, and AI-driven operations.
🌐 Connect & Follow:
- Website: WizBrand.com
- Facebook: facebook.com/DevOpsSchool
- X (Twitter): x.com/DevOpsSchools
- LinkedIn: linkedin.com/company/devopsschool
- YouTube: youtube.com/@TheDevOpsSchool
- Instagram: instagram.com/devopsschool
- Quora: devopsschool.quora.com
- Email– contact@devopsschool.com
Find Trusted Cardiac Hospitals
Compare heart hospitals by city and services — all in one place.
Explore Hospitals