Introduction
Engineering teams often prioritize speed, yet without clear, measurable indicators, growth frequently stalls amidst technical debt and reactive firefighting. To move from intuition to data-driven excellence, you must track the right DevOps KPIs. These metrics provide the visibility needed to optimize your software delivery, stability, and overall team performance, ensuring every technical update aligns with your business goals. Whether you are refining CI/CD pipelines or scaling your infrastructure, understanding these indicators is the key to sustainable, continuous improvement. For those eager to master the engineering workflows that make these metrics actionable, platforms like DevOpsSchool provide the practical expertise required to elevate your organization’s DevOps maturity.
What Are DevOps KPIs?
At their core, DevOps KPIs (Key Performance Indicators) are quantifiable measurements used to evaluate the success of your DevOps practices. Think of them as the vitals of your software development lifecycle. Just as a doctor checks heart rate and blood pressure to assess overall health, an engineering lead checks these metrics to assess the health of their delivery pipeline.
There is a distinction between a generic metric and a KPI. A metric is simply a data point—for example, the number of lines of code committed in a day. A KPI is a metric that is tied to a specific goal or outcome that matters to the business and the team’s efficiency.
If your goal is to increase release velocity, the number of deployments per week is a KPI. If your goal is to reduce downtime, the Mean Time to Restore (MTTR) is a KPI. The key is to select metrics that are actionable. If you track a number but cannot take an action to improve it, it is likely just a vanity metric.
Why DevOps KPIs Matter for Growth
Growth in DevOps is not just about shipping more features; it is about scaling the ability to deliver value reliably. Here is why tracking these KPIs is non-negotiable for a growing organization:
1. Faster Decision-Making
When you have a data-driven view of your pipeline, you stop having debates based on opinions. You do not need to guess why releases are slow; the data will point directly to the testing phase or the manual approval queue.
2. Improved Delivery Performance
KPIs allow you to identify bottlenecks. If you know that your change failure rate is rising, you can slow down and focus on quality before the problem becomes a systemic failure.
3. Better Team Alignment
When the entire organization agrees on what success looks like—for instance, “We want to improve our deployment frequency by 20% this quarter”—the focus of developers, QA, and operations becomes unified.
4. Reduced Operational Risk
By tracking reliability metrics, you catch stability issues early. It is significantly cheaper and less stressful to fix a bug in a staging environment than to handle a critical outage on Black Friday.
Core Categories of DevOps KPIs
To measure the full spectrum of your engineering performance, you should categorize your metrics. This prevents you from focusing too heavily on speed while ignoring quality, or vice versa.
| Category | Purpose | Examples |
| Speed Metrics | Measures velocity of delivery | Deployment Frequency, Lead Time |
| Stability Metrics | Measures reliability of production | MTTR, Change Failure Rate |
| Quality Metrics | Measures the soundness of code | Test Coverage, Defect Escape Rate |
| Efficiency Metrics | Measures resource utilization | CI/CD Pipeline Duration |
| Business Metrics | Measures value to the end user | SLA Compliance, Feature Usage |
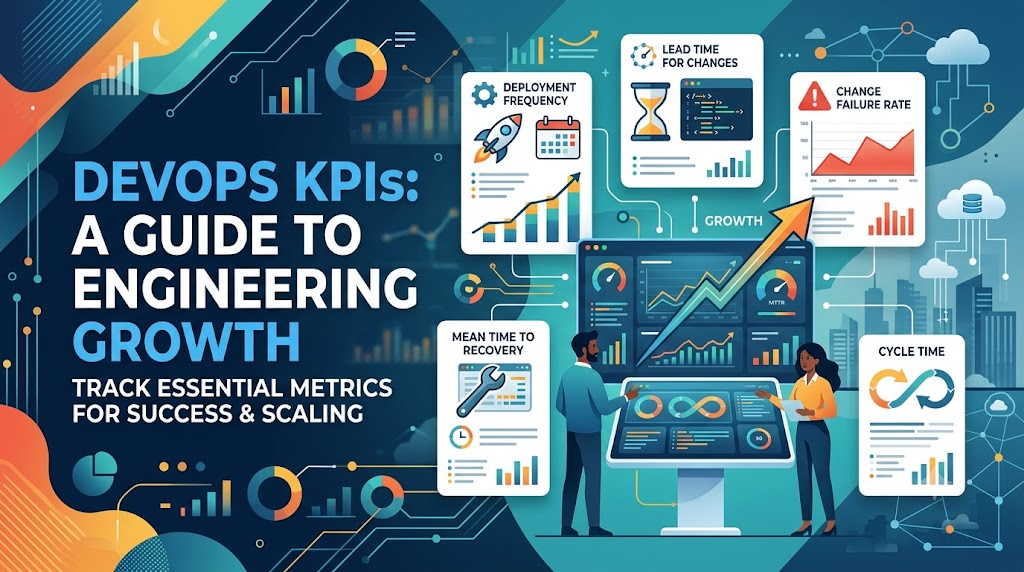
DORA Metrics: The Foundation of DevOps KPIs
The DORA (DevOps Research and Assessment) metrics are the gold standard for measuring DevOps performance. If you are starting your measurement journey, these are the only four you need to begin with.
Deployment Frequency
This measures how often your team successfully releases code to production. High-performing teams deploy on-demand. If you are deploying once a month, you are likely accumulating risk. Small, frequent updates are safer and easier to troubleshoot than massive “big bang” releases.
Lead Time for Changes
This tracks the time it takes for a commit to get into production. This is the ultimate indicator of your team’s agility. A long lead time usually signals a clogged pipeline, bureaucratic approval processes, or a lack of automation.
Change Failure Rate
Of the changes you push to production, what percentage results in a failure that requires a rollback or a hotfix? This keeps the “speed” metrics in check. You want to be fast, but not at the expense of quality.
Mean Time to Restore (MTTR)
When things inevitably break—and they will—how quickly can you recover? A low MTTR indicates that your observability and incident response processes are mature. It is often more important to be able to recover quickly than it is to never fail at all.
CI/CD Pipeline Performance KPIs
Your CI/CD pipeline is the engine of your delivery process. If the engine is misfiring, your speed will suffer.
- Build Success Rate: The percentage of builds that pass without error. A low rate suggests flaky tests or environment instability.
- Pipeline Duration: The time from the start of a build to the end of the deployment. If your pipeline takes an hour, developers will switch context and lose productivity. Aim for fast feedback cycles.
- Deployment Success Rate: This focuses on the technical execution of the deployment. Does the code reach the server and start correctly?
- Test Automation Coverage: The percentage of your codebase covered by automated tests. Without this, your change failure rate will almost certainly climb as your project scales.
Reliability and Stability KPIs
Reliability is a feature. If your system is down, it does not matter how fast you can push new code.
- System Uptime: The classic “five nines” measurement. This is often the primary KPI for SRE teams.
- Incident Rate: The number of production incidents within a specific timeframe. This helps you identify trends in system health.
- Error Rate: The frequency of errors in your application logs. High error rates usually precede user-facing outages.
- Service Availability: Ensuring specific critical pathways (like the login or checkout function) are available even if minor features are having issues.
Developer Productivity KPIs
Be careful here. Productivity is not about lines of code written. It is about how much friction a developer encounters.
- Pull Request Cycle Time: How long does a PR sit waiting for review? If this is high, your team is blocked, and knowledge is siloed.
- Code Review Time: The time spent by reviewers actually looking at the code. This should be efficient but thorough.
- Commit Frequency: A measure of how often developers are pushing work. Frequent commits indicate smaller, manageable work units.
- Deployment Readiness: How often does a developer reach a point where they feel their code is ready to ship, but they are held back by external factors?
Business-Aligned DevOps KPIs
Engineering work exists to serve the business. These metrics bridge the gap between technical operations and financial/customer outcomes.
- Customer Impact Metrics: Are we reducing the number of user-reported issues?
- SLA Compliance: Are we meeting the Service Level Agreements promised to our clients?
- Feature Delivery Speed: Not just how fast we deploy code, but how fast we can take a business requirement from idea to revenue-generating feature.
- User Experience Indicators: Performance metrics like page load time or API response time, which directly affect user retention.
Real-World Example: Teams Without KPI Tracking
I once consulted for an organization where the engineering team felt they were doing “DevOps” because they used Jenkins and AWS. However, they had no visibility into their metrics.
The result? They were drowning in “rework.” They would push code, find it broke in production, spend hours rolling it back, and then manually debug the issue. Because they weren’t tracking their Change Failure Rate or MTTR, the management didn’t understand why the team was so stressed and slow. They were working longer hours, but their velocity was actually decreasing because they were spending 70% of their time fixing previous work instead of shipping new features.
Real-World Example: KPI-Driven DevOps Growth
In contrast, consider a team that implemented a simple dashboard tracking DORA metrics. They noticed their Lead Time for Changes was 14 days. By digging into the data, they realized that 10 of those days were spent waiting for manual security reviews.
By automating those security checks and integrating them into the CI/CD pipeline, they reduced the lead time to 3 days within a month. Because they measured the data, they knew exactly where the bottleneck was. The developers were happier because they spent less time waiting and more time coding, and the business was happier because features reached customers faster.
Common Mistakes in DevOps KPI Tracking
To avoid the pitfalls many organizations fall into, keep this checklist handy:
- Tracking Too Many Metrics: Do not create a dashboard with 50 different charts. Start with the “four key” DORA metrics.
- Ignoring Business Outcomes: A technical win is worthless if it doesn’t help the business.
- Focusing on Vanity Metrics: Tracking lines of code or number of commits per day often encourages bad behavior.
- Lack of Baseline Comparison: Metrics mean nothing without context. What was your lead time last month? Is it trending up or down?
- No Continuous Review Process: Tracking KPIs is useless if you don’t hold retrospectives to discuss the data and make changes.
Best Practices for Tracking DevOps KPIs
How do you implement this successfully? Follow these steps:
- Focus on Actionable Metrics: If the metric does not help you make a decision, stop tracking it.
- Align KPIs with Business Goals: Ensure the engineering team understands how their speed impacts customer satisfaction.
- Automate Metric Collection: Do not rely on manual spreadsheets. Use observability tools to pull data directly from your CI/CD pipelines.
- Review KPIs Regularly: Set aside time during your sprint retrospectives to look at the data.
- Improve Iteratively: Do not try to fix everything at once. Pick one metric to improve this quarter and focus your efforts there.
Role of DevOpsSchool in Learning DevOps Metrics
Understanding which metrics to track is the first step, but learning how to implement the automation and workflows that produce this data is the second. Many teams struggle because they lack the foundational knowledge of how to build robust, observable pipelines.
At DevOpsSchool, the focus is on practical engineering skills. Whether you are learning how to set up automated testing, how to build infrastructure-as-code that generates performance logs, or how to design CI/CD pipelines that provide real-time feedback, the learning path should always be tied to these real-world outcomes. You do not just learn to use a tool; you learn to use a tool to improve a metric.
Career Benefits of Understanding DevOps KPIs
For professionals, mastering the art of KPI-driven development is a career accelerator.
- DevOps Engineer: You become the person who optimizes the flow of value, not just the one who maintains the server.
- SRE Engineer: You define the reliability standards that keep the business running.
- Cloud Engineer: You understand the cost and performance implications of your architectural choices.
- Platform Engineer: You build the internal developer platforms that enable the whole company to measure and improve their work.
- Engineering Manager: You gain the ability to communicate the health of your department to stakeholders using the language of business value.
Industries That Rely on DevOps KPIs
The need for these metrics is universal, but the stakes vary by industry:
- SaaS: Speed to market is everything. Every minute of downtime is a direct loss of revenue.
- Banking: Change failure rate and security compliance are critical; you cannot afford errors that compromise financial data.
- Healthcare: Reliability and traceability are paramount for patient safety and regulatory compliance.
- E-Commerce: During peak times like sales events, uptime and performance are the difference between profit and loss.
- Telecom: Managing massive scale requires rigorous performance and stability monitoring.
- Enterprise IT: Complexity is the enemy, and KPIs are the only way to manage large-scale architectural debt.
Future of DevOps KPI Tracking
The field is evolving rapidly. We are moving toward:
- AI-Driven Analytics: Instead of just looking at dashboards, AI will suggest: “If you reduce test suite time by 10 minutes, you will increase deployment frequency by 15%.”
- Predictive Engineering Insights: Using historical data to predict when a service is likely to fail before it actually happens.
- Automated Performance Optimization: Systems that self-tune and self-heal based on real-time KPIs.
- Real-Time Observability Dashboards: Moving away from static reports to dynamic, real-time views of the entire organization’s health.
FAQs
1. What are DevOps KPIs?
DevOps KPIs are measurable values used to evaluate the efficiency and effectiveness of your software delivery process, such as speed and reliability.
2. Why are KPIs important in DevOps?
They turn subjective feelings (“I think we are slow”) into objective data, allowing teams to identify bottlenecks and improve performance systematically.
3. What are DORA metrics?
They are the four essential metrics—Deployment Frequency, Lead Time for Changes, Change Failure Rate, and Mean Time to Restore—used to measure high-performing DevOps teams.
4. How do you measure DevOps success?
Success is measured by how well your team balances speed (how fast you ship) with stability (how reliably the system stays up).
5. What is MTTR?
Mean Time to Restore (or Recovery) measures how long it takes to recover from a production failure.
6. What is deployment frequency?
It is the measure of how often your team pushes code to production, a key indicator of agility.
7. What is a good KPI in DevOps?
A good KPI is actionable. If you can see a data point and immediately know what step to take to improve it, it is a good KPI.
8. How do KPIs improve performance?
They force teams to focus on the processes that are currently failing, rather than guessing what needs improvement.
9. Can KPIs cause bad behavior?
Yes, if you choose the wrong ones (e.g., lines of code) or use them to punish team members instead of improving systems.
10. What is Lead Time for Changes?
It is the time from the moment code is committed until it is running successfully in production.
11. Is test coverage a good KPI?
It is a useful indicator of quality, but it should not be the only metric; high coverage does not always mean high quality.
12. How often should I review my KPIs?
At a minimum, review them during every sprint retrospective or at least monthly.
13. What is the difference between SRE metrics and DevOps KPIs?
They often overlap. SRE metrics focus heavily on system reliability, while DevOps KPIs cover the entire lifecycle, including development speed.
14. Are these metrics suitable for small teams?
Yes. Even a team of two can benefit from knowing their deployment frequency and failure rate.
15. How do I start tracking?
Start by identifying your most painful bottleneck. If it is deployment speed, start tracking your pipeline duration and deployment frequency.
Final Thoughts
DevOps is a journey, not a destination. When I work with engineering teams, I often tell them that what you measure is what you improve. If you measure nothing, you will likely remain stagnant.
By implementing a rigorous approach to DevOps KPIs, you move your culture from one driven by opinion, intuition, and “firefighting” to one driven by data, evidence, and continuous improvement. Focus on the metrics that reflect the health of your system and the happiness of your team. Start small, track consistently, and let the data guide your growth.
Find Trusted Cardiac Hospitals
Compare heart hospitals by city and services — all in one place.
Explore Hospitals
The article highlights key DevOps KPIs effectively, but one aspect that is often overlooked is the risk of optimizing for metrics without considering overall engineering outcomes. As teams mature, KPIs should be reviewed alongside business impact, system reliability, and developer experience to avoid creating incentives that favor speed over quality. It would also be valuable to discuss how organizations establish metric ownership, maintain consistent measurement across teams, and periodically refine KPIs as architectures, delivery models, and operational priorities evolve.