
Prometheus PromQL Example Query: node exporter
For your Linux Node Exporter target, these are the most important PromQL queries for CPU, RAM, Disk, Network, Load, Uptime. Your uploaded metrics include Node Exporter metrics…
Master Monitoring with Prometheus and Grafana Training in Hyderabad
Introduction Have you ever wondered how big companies keep their websites and apps running smoothly without problems? When you shop online or use a banking app, there…
Master Monitoring with Prometheus & Grafana Training in Chennai
Introduction In today’s fast-moving world of software and IT, keeping a close watch on your systems is not just helpful—it is essential. Think about it: when a…
Master Modern Monitoring: Prometheus and Grafana Training in Bangalore
Introduction Have you ever felt like you’re flying blind when managing your software applications? Imagine a car without a dashboard—no speedometer, no fuel gauge, no warning lights….
What is Prometheus and use cases of Prometheus?
What is Prometheus? Prometheus is an open-source monitoring and alerting toolkit designed for reliability and scalability. It is particularly well-suited for monitoring dynamic, cloud-native environments. Prometheus focuses…
Prometheus Assignment & Excercise
Rajesh KumarI’m Rajesh Kumar, a DevOps, SRE, DevSecOps, Cloud, and Platform Engineering expert passionate about sharing practical knowledge, real-world experiences, and industry best practices. I have worked…
What is Prometheus & Grafana and best course and certification in India
What is Prometheus and Grafana Prometheus After realizing that the metrics and monitoring tools they were using at the time (StatsD and Graphite) were insufficient for their…
Top 50 Prometheus Interview Questions and Answers
What is Prometheus? Prometheus is developed at soundcloud and integrated into the CNCF, it has the ability for creating user specific customs alerts and notifications which is…
Topics to learn in Prometheus with Grafana Training
1. Introduction – Prometheus Introduction to Prometheus Prometheus installation Grafana with Prometheus Installation 2. Monitoring Introduction to Monitoring Client Libraries Pushing Metrics Querying Service Discovery Exporters 3….

TOP 20 INTERVIEW QUESTION FOR PROMETHEUS AND GRAFANA
Interview questions for Grafana:- 1.What is Grafana? Grafana helps us by allowing us to query, visualization, alert and explore our metrics no matter where they are stored,…
Prometheus PromQL Example Query: Monitoring Kubernetes
Count of pods per cluster and namespace. Having a list of how many pods your namespaces have in your cluster can be useful for detecting an unusually…
Using Expression browser in Prometheus
The expression browser is available at /graph on the Prometheus server, allowing you to enter any expression and see its result either in a table or graphed…
Prometheus PromQL Example Query
This should return a number of different time series (along with the latest value recorded for each), all with the metric name promhttp_metric_handler_requests_total, but with different labels….
Interview Questions & Answer for Prometheus
What is Prometheus? What are some of Prometheus’s main features? Describe Prometheus architecture and components Can you compare Prometheus to other solutions like InfluxDB for example? What…
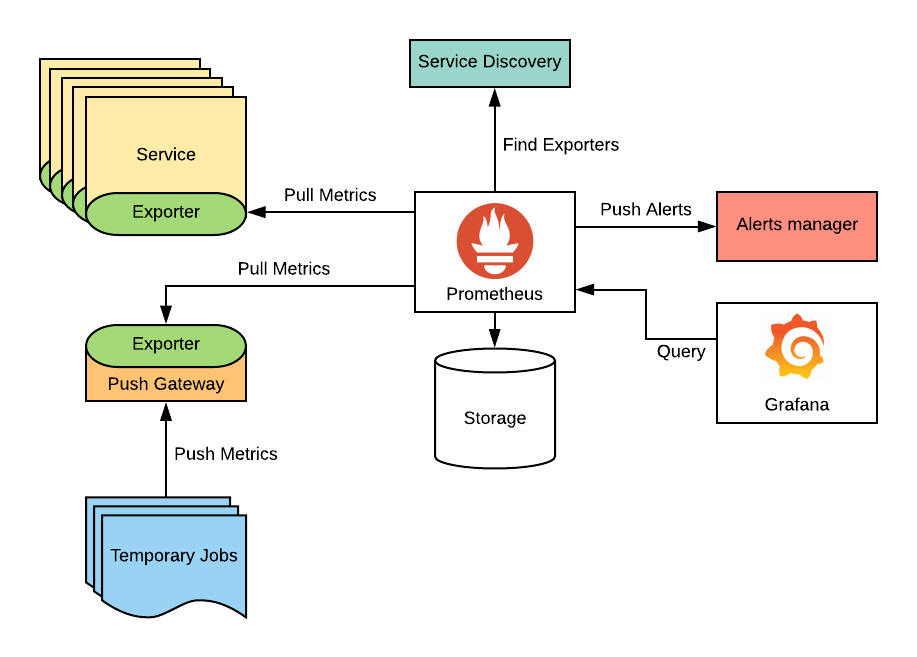
What is Prometheus and How it works?
Meaning of Prometheus In Greek mythology, Prometheus, possibly meaning “forethought”), is a Titan god of fire. Prometheus is known for his intelligence and for being a champion…
Recording rules and Alerting rules explained in Prometheus!!!
What is rules in Prometheus? Time series queries can quickly become quite complicated to remember and type using the Expression Browser in the default Prometheus User Interface….