
Splunk Observability Cloud vs Splunk AppDynamics vs Splunk Cloud Platform
Here’s a clear and updated comparison between Splunk Observability Cloud, Splunk AppDynamics, and Splunk Cloud Platform, highlighting their purpose, strengths, and ideal use cases: 📦 Product Overview…
Top 10 Remote Monitoring & Management (RMM) Tools in 2026: Features, Pros, Cons & Comparison
Introduction In today’s fast-paced, technology-driven world, businesses rely on the seamless functioning of their IT infrastructure. This makes Remote Monitoring & Management (RMM) tools essential for managing,…
Datadog Demo: Introduction Video
Rajesh KumarI’m Rajesh Kumar, a DevOps, SRE, DevSecOps, Cloud, and Platform Engineering expert passionate about sharing practical knowledge, real-world experiences, and industry best practices. I have worked…
ISO/IEC 42001: Build an AI Management System with Risk Controls, Impact Assessments, and Continuous Monitoring
An organization adds an AI assistant to customer support. It works well during a demo, but nobody has defined which data it may use, how harmful answers…
How to Install Datadog CLI on macOS, Windows, and Linux: Complete Step-by-Step Guide
SEO Title: How to Install Datadog CLI on Mac, Windows & Linux – Complete 2026 Tutorial Meta Description: Learn how to install Datadog Pup CLI and Datadog…
How to Install Nagios XI from Tarball and Set Up Client Monitoring Paths
This revised guide walks through a practical Nagios XI server installation using the tarball/fullinstall method from the original post, then shows how to validate access and plan client monitoring. It also adds a clear workflow diagram, command examples, and a comparison of common client check methods.
Server Configuration Monitoring and Diagnostics: A Practical Drift-Detection Workflow
Learn how to monitor server configuration drift and run fast diagnostics when something changes unexpectedly. This guide gives a practical workflow, approach comparison, and command examples you can adapt to your environment.
DevOps Tools Collection: A Practical Guide to CI, SCM, Monitoring, and Platform Choices
This revised guide turns the original link collection into a structured DevOps resource map. Use it to navigate tool categories, compare adoption models, and bootstrap a practical toolchain.
UCC vs CLOC vs POWERSOFTWARE vs EZ-Metrics vs Metrixware: Cleaned 2013 Comparison and Evaluation Workflow
This revised article cleans up a legacy 2013 comparison of five code metrics tools and preserves the original claims in a readable format. It also adds a practical workflow and reproducible command examples you can use to evaluate tools on your own codebase.
Registered, filtered, or blocked: what happens to your alert notifications
Every alerting stack has a step nobody tests. The monitor fires correctly, the rule evaluates correctly, and the integration reports success. What happens between that success message…
OpenTelemetry — Complete End-to-End Tutorial
From Zero to Production: Architecture, Traces, Metrics, Logs, OTLP, Collector, Kubernetes, Sampling, Security, Scaling, Troubleshooting and Best Practices Technology: OpenTelemetry / OTelLevel: Beginner → Intermediate → Advanced…
Best Free, Open-Source & Self-Hosted Synthetic Monitoring, Uptime Monitoring and Health-Check Tools
Monitoring a service is no longer just about asking, “Does port 443 respond?” Modern reliability monitoring may need to confirm that DNS resolves correctly, TLS certificates are…
Complete Shift-Right DevOps Strategy for Continuous Monitoring and Reliability
Introduction Modern software delivery is an evolutionary journey rather than a static timeline, meaning that a flawless pre-production pipeline no longer guarantees real-world production reliability when complex…
AI Overview Monitoring Tools 2026: The Visibility Intelligence Engines Behind Google’s AI Overviews
Google’s AI Overviews introduced a new data layer that can’t be analyzed through classic rank tracking. Instead of showing a single list of results, these summaries pull…
Top 10 AI Driver Monitoring Systems: Features, Pros, Cons & Comparison
Introduction AI Driver Monitoring Systems are intelligent safety technologies that use artificial intelligence, computer vision, sensors, and real-time analytics to understand driver behavior and improve road safety….
AI Forestry & Biodiversity Monitoring: Top 10 Platforms, Use Cases, Architecture
Introduction AI Forestry & Biodiversity Monitoring refers to the use of artificial intelligence, satellite imagery, IoT sensors, acoustic monitoring, and computer vision to track forest health, wildlife…
Prometheus PromQL Example Query: node exporter
For your Linux Node Exporter target, these are the most important PromQL queries for CPU, RAM, Disk, Network, Load, Uptime. Your uploaded metrics include Node Exporter metrics…
5-Day Program: Splunk for Email Security, SIEM & Endpoint Security
Program Title Splunk Security Operations Masterclass: Email Security, SIEM & Endpoint Detection Duration 5 DaysRecommended format: 6–7 hours per dayMode: Instructor-led + hands-on labs + final SOC…
Datadog Assignment & Project Master Plan
Target Audience This lab is suitable for: DevOps engineers, SREs, cloud engineers, platform engineers, application engineers, monitoring engineers, and students learning Datadog from practical implementation. Final Outcome…
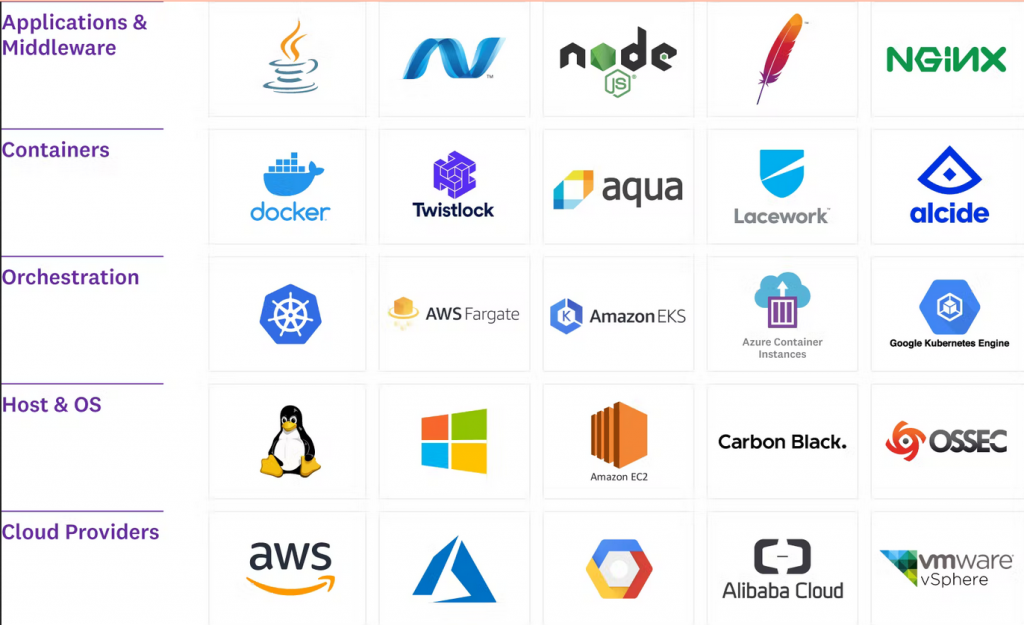
Datadog Cloud SIEM: Complete End-to-End Master Guide
Current as of June 2026. Datadog Cloud SIEM is Datadog’s security information and event management product for collecting security telemetry, analyzing logs and events with detection rules,…
Datadog Agent Commands with Examples
Below is a Datadog Agent command cheat sheet in table format. I’m focusing only on Agent CLI / Agent service commands, with practical examples and explanations. The…
Datadog Troubleshooting Master Guide
It covers: Datadog Agent, Kubernetes Agent, Cluster Agent, integrations, logs, APM/traces, custom metrics, DogStatsD, OpenTelemetry, API keys, Terraform, monitors, SLOs, RUM, Synthetics, cloud integrations, cost, permissions, and…
Datadog FAQ / Interview Questions and Answers — 50 Questions
Below is a Datadog theoretical / approach / capability FAQ set — not MCQ style. These are the kinds of questions that usually come in interviews, internal…
Datadog Interview Questions and Answer
1. What is Datadog primarily used for? A. Source code version controlB. Infrastructure, application, log, and security observabilityC. Database schema migration onlyD. Static website hosting Correct Answer:…
Datadog Agent CLI — datadog-agent and Windows agent.exe with examples
This guide covers the Datadog Agent command-line interface for: The Datadog Agent CLI is subcommand-based. Datadog’s current Agent command documentation says the general syntax is: and recommends…
Datadog Tutorial: Create Monitors / Alerts using Datadog API — Step by Step
This guide uses the current Datadog Monitor API v1, which is still the main API for creating metric, log, APM, and many other monitor types. Datadog’s API…
Datadog Log: Lab and Assignment
Lab Manual: Datadog Logs Search, Filter, Sorting, Display, and Analysis Hands-on Datadog Logs Explorer Lab using Ubuntu Linux Logs and Apache Logs Lab Objective By the end…
What is Datadog: Observability, Monitoring, SIEM, AIOps, Security, and DevOps Platform
Datadog is a SaaS-based observability, monitoring, security, and service-management platform used by DevOps, SRE, platform, application, security, and business teams to understand the health, performance, reliability, cost,…
Top 10 AI Regulatory Change Monitoring Tools with NLP: Features, Pros, Cons & Comparison
Introduction AI Regulatory Change Monitoring with NLP refers to intelligent systems that continuously scan laws, regulatory updates, government publications, compliance bulletins, and legal databases, then use Natural…
AI-Assisted Observability: Turning Logs into Actionable Insights
Introduction There is a specific kind of dread that every on-call engineer knows. It is 2:47 AM. Your phone is screaming. Latency on the checkout service has…