Introduction
As a network grows, finding and ensuring the Best IT Infrastructure Monitoring Tools and Software for your Business is critical in today’s complex and ever-growing eco-system of technology.
In fact, these tools are utilize to ensure that networks never slow down or stop functioning when critical business and production applications need to be online.
Generally speaking, Opting for an appropriate monitoring solution for your business is not as easy as it seems.
Computers, servers, switches, routers, and virtual machines are just some of the diverse infrastructure that comprises a modern network, these tools help you stay on top of your devices’ performance, allow you to add or remove devices, ensure constant availability and send alerts when something is likely to go wrong.
What Is Infrastructure Monitoring?
Infrastructure Monitoring involves diagnosing performance and monitoring network infrastructure for vulnerabilities. Infrastructure monitoring tools monitor the health status, availability, and performance of devices throughout the network.
With so many key players and moving parts to monitor, automation is key. Automated infrastructure monitoring allows for rapid response. Using an infrastructure monitoring tool is important because attempting to stay on top of network events manually would be next to impossible. A network administrator could not realistically keep track of all physical and virtual resources.
Why Is Infrastructure Monitoring Important?
There are a number of key reasons why having total visibility over the IT infrastructure is important for business.
- Full Control Over IT Resources
- Informed Decision Making
- Increased Productivity and Enhanced Service Availability
- Recognize Security Threats
- Fix IT Performance Issues Quickly
- Avoid Network Outages
What to monitor?
IT Infrastructure Monitoring is the centralized monitoring of the performance and availability of key hardware and software resources required to provision applications and includes:
- Servers
- Private, Hybrid, and Public Cloud Resources
- Network
- Operational software (i.e. Active Directory, DHCP, Hardware health, etc.)
How to Monitor?
The whole idea behind effective IT infrastructure monitoring is to proactively detect problem symptoms before users are affected.
- Collection and Evaluation – What type of IT Infrastructure data is collected/evaluated and how often?
- Alerting and Automation- How are IT and their constituents notified when performance and availability are compromised?
- Dash-boarding – How is the health of the IT Infrastructure visualized?
- Reporting – How are performance and availability metrics quantified over time?
Here in this article we are going to make it easy for you when it comes to monitoring solutions. Let’s take a look at the top-rated infrastructure monitoring tools and see what works for you!
OPM Plus
OPM Plus (OpManager Plus) is an integrated IT operations management solution from ManageEngine that offers a unified platform for network monitoring, server management, application performance monitoring, configuration management, and firewall log analysis.
It helps IT teams gain complete visibility into their hybrid infrastructure, ensuring high availability, optimized performance, and faster incident resolution — all through a centralized console.
New Relic
New Relic has established itself as one of the best infrastructure monitoring tools for several reasons, particularly due to its comprehensive features and focus on full-stack observability. Here are key aspects that make New Relic stand out:
- Full-Stack Observability: New Relic provides a unified view of your entire software stack. This means you can monitor and troubleshoot not just your infrastructure but also your applications, end-user experience, and more, all in one place.
- Real-Time Analytics: It offers real-time analytics and visualization capabilities, helping teams to quickly understand and act on the vast amounts of data generated by their IT systems.
- Scalability and Flexibility: New Relic is designed to scale with your infrastructure, making it suitable for both small businesses and large enterprises. Its flexibility allows it to monitor a wide range of environments, from on-premises servers to cloud-based services.
- Customizable Dashboards and Alerts: Users can create custom dashboards to focus on the metrics that matter most to them. Alerting capabilities ensure that teams are notified promptly when issues arise, facilitating quick response times.
- Application Performance Monitoring (APM): New Relic’s APM capabilities are particularly strong, allowing detailed monitoring and troubleshooting of application performance issues, which is crucial in a world where application health directly impacts user experience and business outcomes.
- Integration and Extensibility: It integrates well with a wide range of other tools and services, which is valuable in complex IT environments where multiple different technologies need to be monitored and managed together.
- User-Friendly Interface: The tool is known for its user-friendly interface, making it easier for new users to get up to speed and for teams to collaborate effectively.
- AI and Machine Learning Capabilities: New Relic leverages AI and machine learning for advanced anomaly detection and automated incident response, which enhances the proactive monitoring capabilities.
- Community and Support: New Relic has a strong community and offers robust support. This community-driven approach means users have access to a wealth of shared knowledge and resources.
- Continual Innovation: They are known for continually updating and improving their platform, staying ahead with the latest trends and technologies in infrastructure monitoring.
Zabbix

Zabbix is an open source monitoring tool. This network monitoring tool focuses on monitoring and trending functionality. This software is widely used for monitoring servers and network hardware. This tool can forecast future behavior based on historical data.
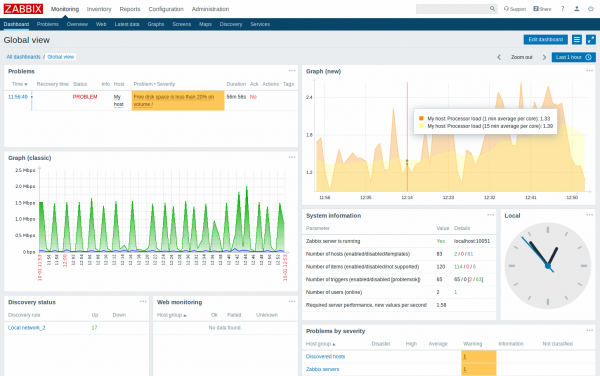
Features:
- Easy measurement of network performance & health
- Flexible and extendable data gathering
- Various metric collection methods and protocols
- Configuration changes
SolarWinds Network Performance Monitor

This tool automatically discovers network devices and deploys within an hour. With the help of this tool, you can customize the web-based performance dashboards, charts, and views.
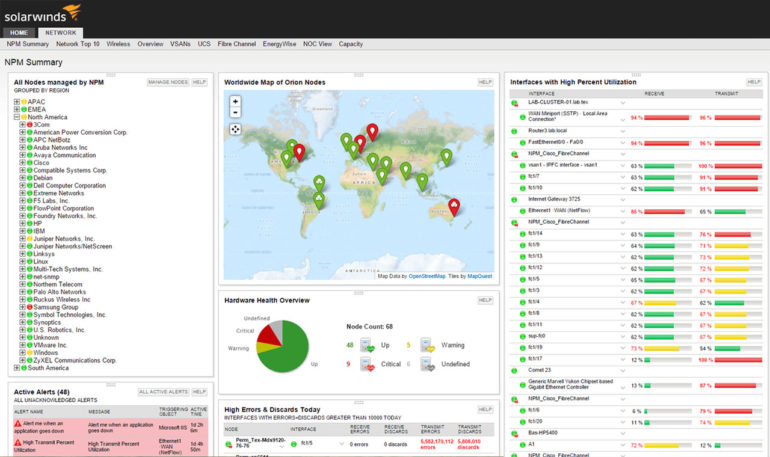
Features:
- Multi-vendor network monitoring
- Complete network Insights for better visibility
- NetPath and PerfStack for easy troubleshooting
- Smarter scalability for large environments
Incinga

It is open source infrastructure and service monitoring tool. Icinga alters and reports the health of your IT environment. All alert dependencies will be displayed in the dashboard and sent via email, SMS or mobile messaging apps.
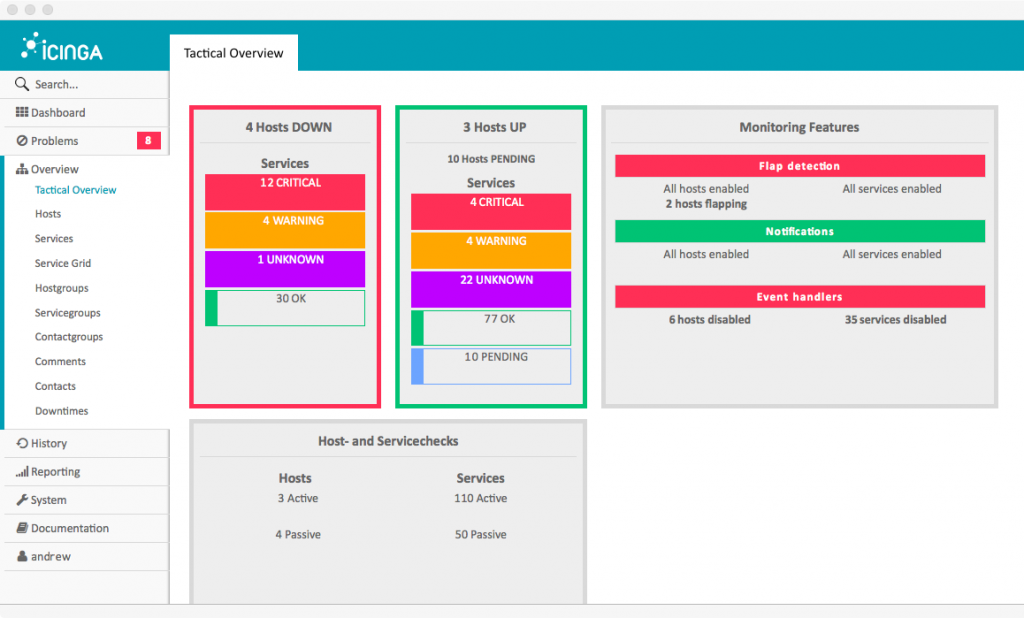
Features:
- Monitoring of Services
- Supports both direct monitoring and SNMP monitoring
- Allows clustering and Zone Monitoring
- Configuration & Templates
Splunk

Splunk is a monitoring tool which allows you to simplify and modernize IT to increase uptime and a competitive edge. It will enable you to get seamless monitoring and troubleshooting.
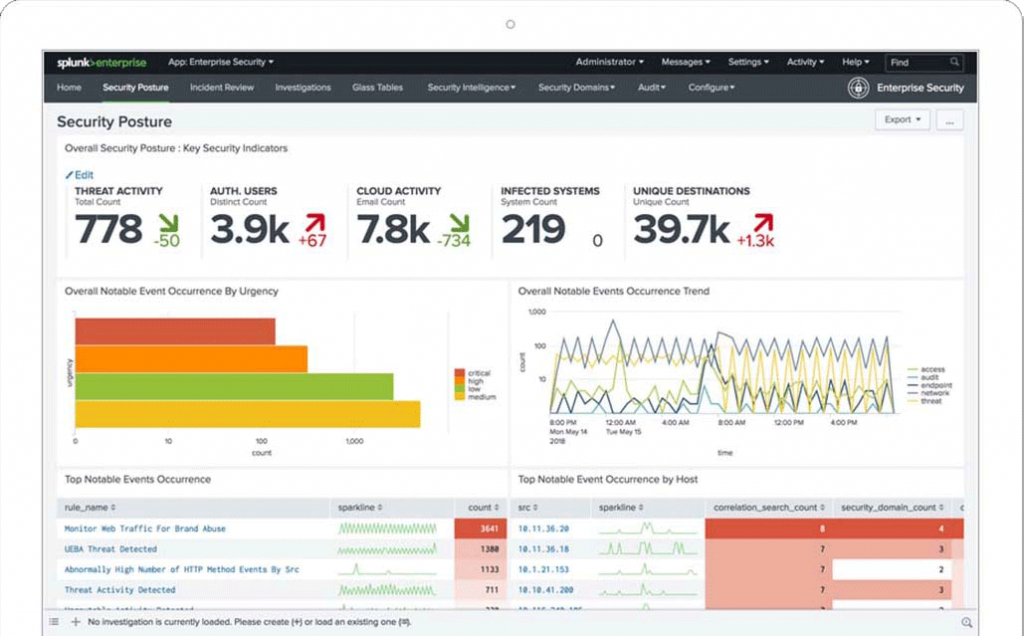
Features:
- Prevent Business Outages
- Make Informed Decisions
- Real-time and Predictive Insights
- Visibility for IT and the Business
- Resolve Issues Quickly
Datadog
Datadog is a monitoring tool which is built for hybrid cloud environments. Datadog helps you to analyze the performance of network, apps, and services. It allows you to create custom graphs, meters, and alerts.
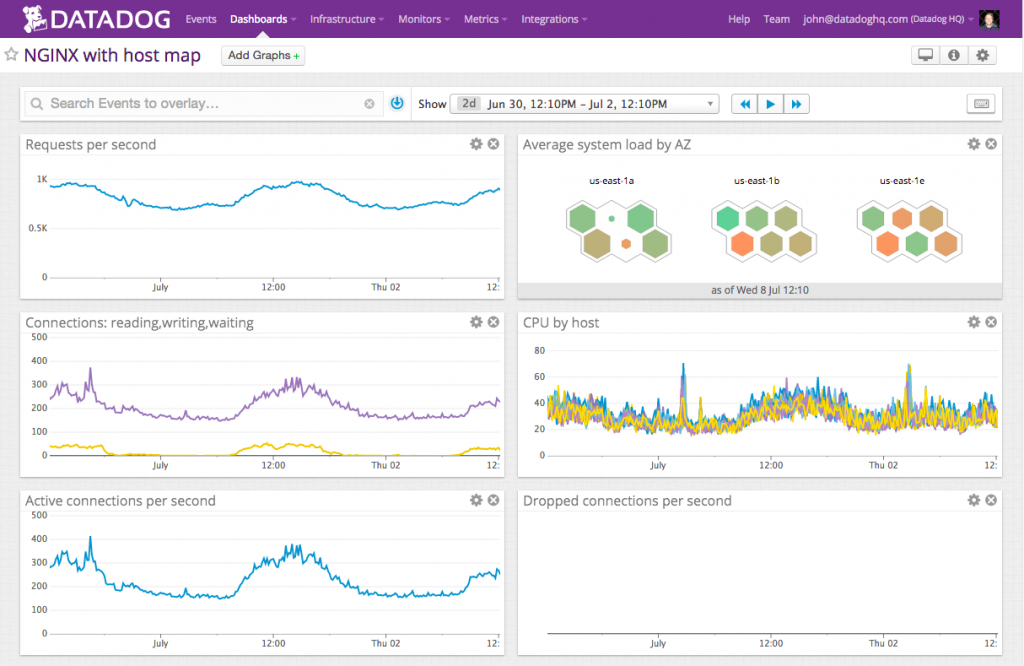
Features:
- Allows you to check across systems, apps, and services
- Get full visibility into your applications.
- Analyze and explore log data in the context
- Build real-time interactive dashboards
- Fash alerts on critical issues.
Dynatrace
Dynatrace system monitoring tool allows you to auto-discover and baseline your entire IT ecosystem in the very less time. It allows you to monitor and manage application performance and cloud infrastructure.
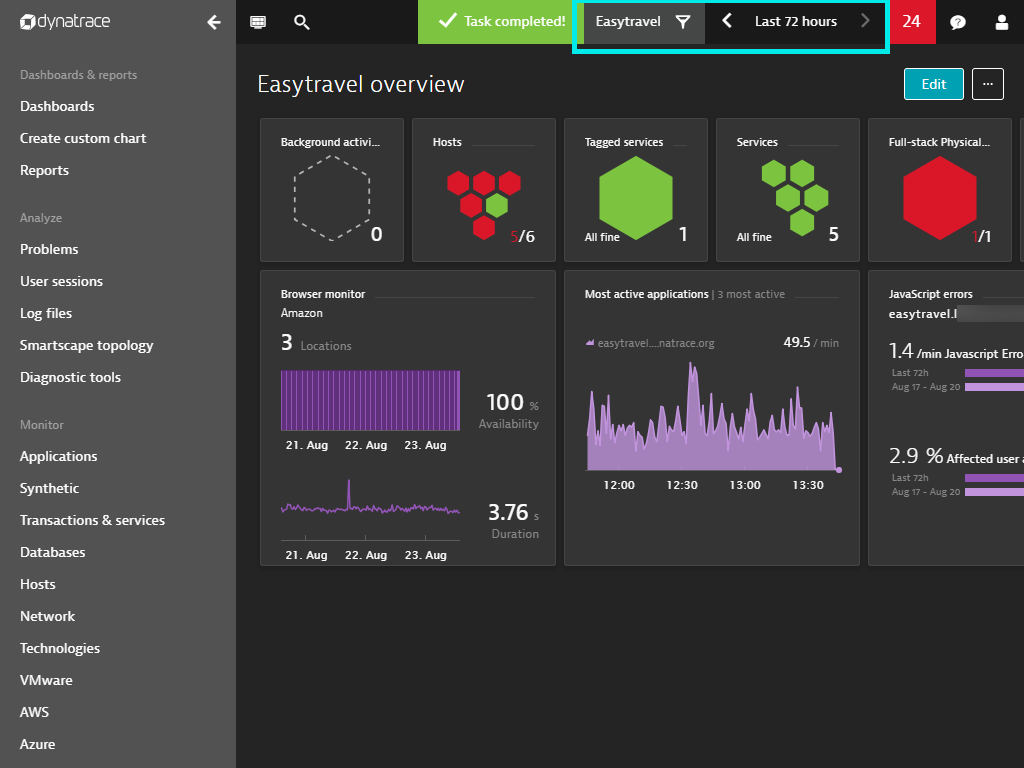
Features:
- Network Solutions for monitoring for business, operations, and development
- Offers Industry-leading monitoring capabilities
- Optimize customer experience
- Deliver high performing applications
- Monitor cloud-native application
Nagios
It is a network monitoring tool allows organizations to identify and resolve IT infrastructure problems before they affect critical business processes.
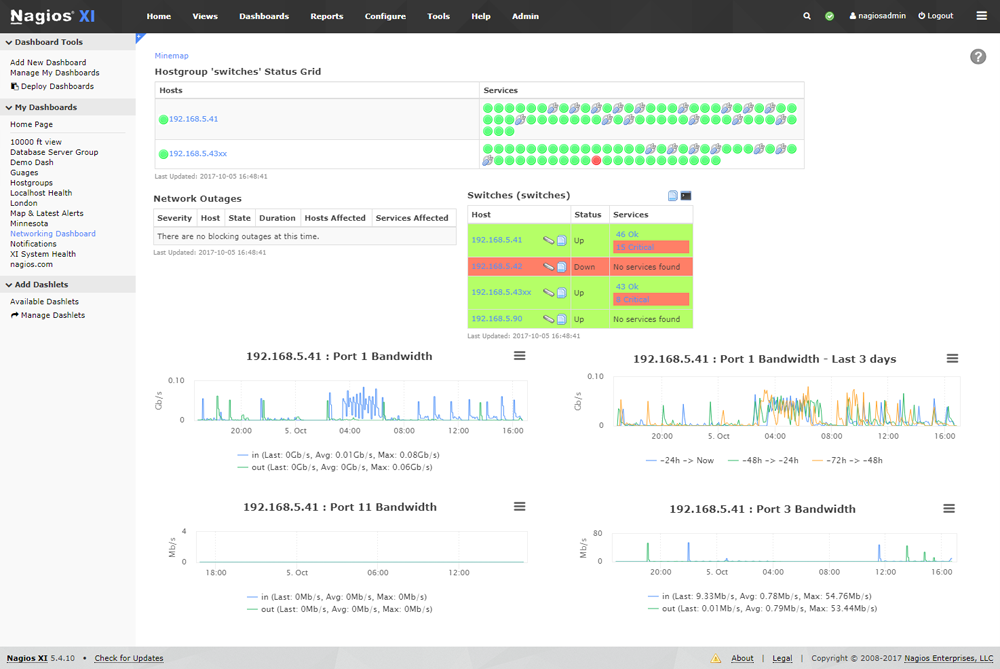
Features:
- Comprehensive Dashboard
- Allows you to keep track of specific subsets of network flow information
- Complete Insights on network traffic, bandwidth, and overall network health
- Receive alerts when the abnormal activity takes place
- Advanced user options allow IT teams to work together efficiently.
AppDynamics
AppDynamics boasts several strengths that make it a contender for the title of “best infrastructure monitoring tool,” but it’s important to acknowledge that “best” can be subjective and depends on your specific needs and priorities. Here’s a breakdown of AppDynamics’s key strengths:
Strengths:
- Full-stack observability: AppDynamics goes beyond basic infrastructure monitoring to offer a comprehensive view of your entire application stack, including code, infrastructure, user experience, and business metrics. This holistic approach allows you to pinpoint the root cause of performance issues more quickly and effectively.
- Real-time insights and proactive alerting: AppDynamics provides real-time data and advanced analytics, allowing you to identify and address potential problems before they impact users. Its AI-powered anomaly detection and machine learning algorithms further enhance proactive monitoring.
- Business-centric visibility: AppDynamics correlates application performance metrics with key business KPIs, like revenue and customer satisfaction. This helps you understand the real-world impact of infrastructure issues and prioritize remediation efforts.
- Cloud-native support: AppDynamics offers built-in capabilities for monitoring modern cloud-based applications and infrastructures, including Kubernetes and containerized environments. This is crucial for organizations embracing cloud adoption.
- Ease of use and customization: AppDynamics provides a user-friendly interface and powerful customization options, allowing you to tailor your monitoring experience to your specific needs.
However, it’s also important to consider some potential drawbacks:
- Complexity and cost: AppDynamics can be a complex tool with a steep learning curve, requiring specialized expertise for optimal utilization. Additionally, it can be more expensive than some of its competitors.
- Integration challenges: While AppDynamics offers various integrations, seamless integration with existing tools and platforms may require additional effort or customization.
Overall, AppDynamics is a powerful and versatile infrastructure monitoring tool with a lot to offer organizations seeking comprehensive visibility and proactive insights. However, it’s crucial to evaluate your specific needs and budget before making a decision. Consider test-driving AppDynamics and comparing it to other options to see which best suits your requirements.
Here are some additional questions that might help you in your decision-making process:
- What are your primary infrastructure monitoring needs and challenges?
- What is your budget for a monitoring tool?
- What level of technical expertise do you have on your IT team?
- How important is cloud-native support for you?
- Do you need extensive integration capabilities with existing tools?
By answering these questions, you can get a better sense of whether AppDynamics is the right fit for your organization.
Prometheus
Whether Prometheus is the “best” infrastructure monitoring tool depends on your specific needs and priorities. It has numerous strengths that make it a popular choice, but also some limitations to consider.
Strengths of Prometheus:
- Open-source and free: Prometheus is an open-source tool, meaning it’s free to use and customize. This can be a significant advantage for cost-conscious organizations.
- Simplicity and scalability: Prometheus is known for its user-friendly interface and straightforward configuration. It scales horizontally effortlessly, making it suitable for large and complex infrastructures.
- Pull-based model: Prometheus pulls metrics from targets proactively, minimizing strain on monitored systems. This makes it less intrusive than push-based tools.
- Powerful query language (PromQL): PromQL allows you to slice and dice your time-series data, making it easy to analyze trends and identify anomalies.
- Alerting and notification: Prometheus integrates seamlessly with alertmanager for proactive notification of potential issues.
- Cloud-native focus: Prometheus excels at monitoring dynamic cloud-native environments like Kubernetes, thanks to its label-based data model.
However, Prometheus also has some limitations:
- Limited out-of-the-box functionality: Unlike some all-in-one monitoring tools, Prometheus requires additional configuration and integrations for comprehensive monitoring.
- Storage and visualization: While Prometheus stores data efficiently, long-term storage and advanced visualization may require additional tools like Grafana.
- Limited log and application performance monitoring: Prometheus primarily focuses on infrastructure metrics. Monitoring logs and application performance might require other tools.
- Learning curve: While user-friendly, Prometheus still has a learning curve for its query language and configuration options.
Overall, Prometheus is a powerful and versatile open-source monitoring tool ideal for:
- Cloud-native environments and Kubernetes clusters.
- Organizations seeking cost-effective and customizable monitoring solutions.
- Teams comfortable with configuration and integration tasks.
I’m Rajesh Kumar, a DevOps, SRE, DevSecOps, Cloud, and Platform Engineering expert passionate about sharing practical knowledge, real-world experiences, and industry best practices. I have worked at Cotocus and regularly write about technology, travel, investing, health, product reviews, and digital marketing through my various platforms.
I publish technical articles at DevOps School, travel stories at Holiday Landmark, stock market insights at Stocks Mantra, health and fitness guidance at My Medic Plus, product reviews at TrueReviewNow, and SEO and digital marketing strategies at Wizbrand.
Find Trusted Cardiac Hospitals
Compare heart hospitals by city and services — all in one place.
Explore Hospitals
A key angle often missing in discussions around infrastructure monitoring tools is the real operational burden of maintaining observability at scale, beyond just tool selection. In production environments, the biggest challenge is not collecting metrics, but managing signal-to-noise ratio, where teams are overwhelmed by alerts that are either duplicated, low-value, or not actionable during incidents.
Another gap is the hidden cost of multi-tool monitoring stacks. Many organizations combine APM, log aggregation, metrics, and cloud-native monitoring tools, but without strong correlation layers, this leads to fragmented visibility and slower incident resolution. In practice, the absence of unified observability (metrics + logs + traces) often creates blind spots during root cause analysis, even when “all data is available.”
There’s also limited focus on alerting governance and incident fatigue, which becomes a major issue as systems scale. Without proper alert deduplication, severity classification, and on-call routing rules, monitoring tools quickly turn into noise generators rather than reliability enablers.
Finally, in modern cloud-native environments, infrastructure monitoring is increasingly tied to dynamic workloads, Kubernetes autoscaling, and ephemeral services, where static thresholds are no longer sufficient. What matters more is adaptive monitoring using anomaly detection, service-level objectives (SLOs), and automated remediation workflows, rather than just dashboards and static alerts.