How to setup Datadog Agent integration with mysql to collect many metrics from MySQL databases?
The Datadog Agent can collect many metrics from MySQL databases, including (but not limited to):
- Query throughput
- Query performance (e.g. average query run time, slow queries, etc.)
- Connections (e.g. currently open connections, aborted connections, errors, etc.)
- InnoDB (e.g. buffer pool metrics, etc.)
You can also create your own metrics using custom SQL queries.
The following metrics will be tracked by this integration:
| Name | Units | Description |
|---|---|---|
| mysql.binlog.cache_disk_use | transactions | The number of transactions that used the temporary binary log cache but that exceeded the value of binlog_cache_size and used a temporary file to store statements from the transaction. |
| mysql.binlog.cache_use | transactions | The number of transactions that used the binary log cache. |
| mysql.binlog.disk_use | bytes | Total binary log file size. |
| mysql.galera.wsrep_cert_deps_distance | Shows the average distance between the lowest and highest sequence number, or seqno, values that the node can possibly apply in parallel. | |
| mysql.galera.wsrep_cluster_size | nodes | The current number of nodes in the Galera cluster. |
| mysql.galera.wsrep_flow_control_paused | fractions | Shows the fraction of the time, since FLUSH STATUS was last called, that the node paused due to Flow Control. |
| mysql.galera.wsrep_flow_control_paused_ns | nanoseconds | Shows the pause time due to Flow Control, in nanoseconds. |
| mysql.galera.wsrep_flow_control_recv | Shows the number of times the galera node has received a pausing Flow Control message from others | |
| mysql.galera.wsrep_flow_control_sent | Shows the number of times the galera node has sent a pausing Flow Control message to others | |
| mysql.galera.wsrep_local_recv_queue_avg | Shows the average size of the local received queue since the last status query. | |
| mysql.galera.wsrep_local_send_queue_avg | Show an average for the send queue length since the last FLUSH STATUS query. | |
| mysql.info.schema.size | mebibytes | Size of schemas in MiB |
| mysql.innodb.buffer_pool_data | bytes | The total number of bytes in the InnoDB buffer pool containing data. The number includes both dirty and clean pages. |
| mysql.innodb.buffer_pool_dirty | bytes | The total current number of bytes held in dirty pages in the InnoDB buffer pool. |
| mysql.innodb.buffer_pool_free | pages | The number of free pages in the InnoDB Buffer Pool. |
| mysql.innodb.buffer_pool_pages_data | pages | The number of pages in the InnoDB buffer pool containing data. The number includes both dirty and clean pages. |
| mysql.innodb.buffer_pool_pages_dirty | pages | The current number of dirty pages in the InnoDB buffer pool. |
| mysql.innodb.buffer_pool_pages_flushed | pages/second | The number of requests to flush pages from the InnoDB buffer pool. |
| mysql.innodb.buffer_pool_pages_free | pages | The number of free pages in the InnoDB buffer pool. |
| mysql.innodb.buffer_pool_pages_total | pages | The total size of the InnoDB buffer pool, in pages. |
| mysql.innodb.buffer_pool_read_ahead | pages/second | The number of pages read into the InnoDB buffer pool by the read-ahead background thread. |
| mysql.innodb.buffer_pool_read_ahead_evicted | pages/second | The number of pages read into the InnoDB buffer pool by the read-ahead background thread that were subsequently evicted without having been accessed by queries. |
| mysql.innodb.buffer_pool_read_ahead_rnd | operations | The number of random read-aheads initiated by InnoDB. This happens when a query scans a large portion of a table but in random order. |
| mysql.innodb.buffer_pool_read_requests | reads/second | The number of logical read requests. |
| mysql.innodb.buffer_pool_reads | reads/second | The number of logical reads that InnoDB could not satisfy from the buffer pool, and had to read directly from disk. |
| mysql.innodb.buffer_pool_total | pages | The total number of pages in the InnoDB Buffer Pool. |
| mysql.innodb.buffer_pool_used | pages | The number of used pages in the InnoDB Buffer Pool. |
| mysql.innodb.buffer_pool_utilization | fractions | The utilization of the InnoDB Buffer Pool. |
| mysql.innodb.buffer_pool_wait_free | waits | When InnoDB needs to read or create a page and no clean pages are available, InnoDB flushes some dirty pages first and waits for that operation to finish. This counter counts instances of these waits. |
| mysql.innodb.buffer_pool_write_requests | writes/second | The number of writes done to the InnoDB buffer pool. |
| mysql.innodb.checkpoint_age | Checkpoint age as shown in the LOG section of the SHOW ENGINE INNODB STATUS output. | |
| mysql.innodb.current_row_locks | locks | The number of current row locks. |
| mysql.innodb.current_transactions | transactions | Current InnoDB transactions |
| mysql.innodb.data_fsyncs | operations/second | The number of fsync() operations per second. |
| mysql.innodb.data_pending_fsyncs | operations | The current number of pending fsync() operations. |
| mysql.innodb.data_pending_reads | reads | The current number of pending reads. |
| mysql.innodb.data_pending_writes | writes | The current number of pending writes. |
| mysql.innodb.data_read | bytes/second | The amount of data read per second. |
| mysql.innodb.data_reads | reads/second | The rate of data reads. |
| mysql.innodb.data_writes | writes/second | The rate of data writes. |
| mysql.innodb.data_written | bytes/second | The amount of data written per second. |
| mysql.innodb.dblwr_pages_written | pages/second | The number of pages written per second to the doublewrite buffer. |
| mysql.innodb.dblwr_writes | bytes/second | The number of doublewrite operations performed per second. |
| mysql.innodb.hash_index_cells_total | Total number of cells of the adaptive hash index | |
| mysql.innodb.hash_index_cells_used | Number of used cells of the adaptive hash index | |
| mysql.innodb.history_list_length | History list length as shown in the TRANSACTIONS section of the SHOW ENGINE INNODB STATUS output. | |
| mysql.innodb.ibuf_free_list | Insert buffer free list, as shown in the INSERT BUFFER AND ADAPTIVE HASH INDEX section of the SHOW ENGINE INNODB STATUS output. | |
| mysql.innodb.ibuf_segment_size | Insert buffer segment size, as shown in the INSERT BUFFER AND ADAPTIVE HASH INDEX section of the SHOW ENGINE INNODB STATUS output. | |
| mysql.innodb.ibuf_size | Insert buffer size, as shown in the INSERT BUFFER AND ADAPTIVE HASH INDEX section of the SHOW ENGINE INNODB STATUS output. | |
| mysql.innodb.log_waits | waits/second | The number of times that the log buffer was too small and a wait was required for it to be flushed before continuing. |
| mysql.innodb.log_write_requests | writes/second | The number of write requests for the InnoDB redo log. |
| mysql.innodb.log_writes | writes/second | The number of physical writes to the InnoDB redo log file. |
| mysql.innodb.lsn_current | Log sequence number as shown in the LOG section of the SHOW ENGINE INNODB STATUS output. | |
| mysql.innodb.lsn_flushed | Flushed up to log sequence number as shown in the LOG section of the SHOW ENGINE INNODB STATUS output. | |
| mysql.innodb.lsn_last_checkpoint | Log sequence number last checkpoint as shown in the LOG section of the SHOW ENGINE INNODB STATUS output. | |
| mysql.innodb.mem_adaptive_hash | bytes | As shown in the BUFFER POOL AND MEMORY section of the SHOW ENGINE INNODB STATUS output. |
| mysql.innodb.mem_additional_pool | bytes | As shown in the BUFFER POOL AND MEMORY section of the SHOW ENGINE INNODB STATUS output. |
| mysql.innodb.mem_dictionary | bytes | As shown in the BUFFER POOL AND MEMORY section of the SHOW ENGINE INNODB STATUS output. |
| mysql.innodb.mem_file_system | As shown in the BUFFER POOL AND MEMORY section of the SHOW ENGINE INNODB STATUS output. | |
| mysql.innodb.mem_lock_system | As shown in the BUFFER POOL AND MEMORY section of the SHOW ENGINE INNODB STATUS output. | |
| mysql.innodb.mem_page_hash | As shown in the BUFFER POOL AND MEMORY section of the SHOW ENGINE INNODB STATUS output. | |
| mysql.innodb.mem_recovery_system | As shown in the BUFFER POOL AND MEMORY section of the SHOW ENGINE INNODB STATUS output. | |
| mysql.innodb.mem_total | bytes | As shown in the BUFFER POOL AND MEMORY section of the SHOW ENGINE INNODB STATUS output. |
| mysql.innodb.mutex_os_waits | events/second | The rate of mutex OS waits. |
| mysql.innodb.mutex_spin_rounds | events/second | The rate of mutex spin rounds. |
| mysql.innodb.mutex_spin_waits | events/second | The rate of mutex spin waits. |
| mysql.innodb.os_log_fsyncs | writes/second | The rate of fsync writes to the log file. |
| mysql.innodb.os_log_pending_fsyncs | operations | Number of pending InnoDB log fsync (sync-to-disk) requests. |
| mysql.innodb.os_log_pending_writes | writes | Number of pending InnoDB log writes. |
| mysql.innodb.os_log_written | bytes/second | Number of bytes written to the InnoDB log. |
| mysql.innodb.pages_created | pages/second | Number of InnoDB pages created. |
| mysql.innodb.pages_read | pages/second | Number of InnoDB pages read. |
| mysql.innodb.pages_written | pages/second | Number of InnoDB pages written. |
| mysql.innodb.pending_aio_log_ios | As shown in the FILE I/O section of the SHOW ENGINE INNODB STATUS output. | |
| mysql.innodb.pending_aio_sync_ios | As shown in the FILE I/O section of the SHOW ENGINE INNODB STATUS output. | |
| mysql.innodb.pending_buffer_pool_flushes | flushes | As shown in the FILE I/O section of the SHOW ENGINE INNODB STATUS output. |
| mysql.innodb.pending_checkpoint_writes | As shown in the FILE I/O section of the SHOW ENGINE INNODB STATUS output. | |
| mysql.innodb.pending_ibuf_aio_reads | As shown in the FILE I/O section of the SHOW ENGINE INNODB STATUS output. | |
| mysql.innodb.pending_log_flushes | flushes | As shown in the FILE I/O section of the SHOW ENGINE INNODB STATUS output. |
| mysql.innodb.pending_log_writes | writes | As shown in the FILE I/O section of the SHOW ENGINE INNODB STATUS output. |
| mysql.innodb.pending_normal_aio_reads | reads | As shown in the FILE I/O section of the SHOW ENGINE INNODB STATUS output. |
| mysql.innodb.pending_normal_aio_writes | writes | As shown in the FILE I/O section of the SHOW ENGINE INNODB STATUS output. |
| mysql.innodb.queries_inside | queries | As shown in the FILE I/O section of the SHOW ENGINE INNODB STATUS output. |
| mysql.innodb.queries_queued | queries | As shown in the FILE I/O section of the SHOW ENGINE INNODB STATUS output. |
| mysql.innodb.read_views | As shown in the FILE I/O section of the SHOW ENGINE INNODB STATUS output. | |
| mysql.innodb.row_lock_current_waits | The number of row locks currently being waited for by operations on InnoDB tables. | |
| mysql.innodb.row_lock_time | fractions | Fraction of time spent (ms/s) acquiring row locks. |
| mysql.innodb.row_lock_waits | events/second | The number of times per second a row lock had to be waited for. |
| mysql.innodb.rows_deleted | rows/second | Number of rows deleted from InnoDB tables. |
| mysql.innodb.rows_inserted | rows/second | Number of rows inserted into InnoDB tables. |
| mysql.innodb.rows_read | rows/second | Number of rows read from InnoDB tables. |
| mysql.innodb.rows_updated | rows/second | Number of rows updated in InnoDB tables. |
| mysql.innodb.s_lock_os_waits | /second | As shown in the SEMAPHORES section of the SHOW ENGINE INNODB STATUS output |
| mysql.innodb.s_lock_spin_rounds | /second | As shown in the SEMAPHORES section of the SHOW ENGINE INNODB STATUS output. |
| mysql.innodb.s_lock_spin_waits | waits/second | As shown in the SEMAPHORES section of the SHOW ENGINE INNODB STATUS output. |
| mysql.innodb.x_lock_os_waits | waits/second | As shown in the SEMAPHORES section of the SHOW ENGINE INNODB STATUS output. |
| mysql.innodb.x_lock_spin_rounds | As shown in the SEMAPHORES section of the SHOW ENGINE INNODB STATUS output. | |
| mysql.innodb.x_lock_spin_waits | waits | As shown in the SEMAPHORES section of the SHOW ENGINE INNODB STATUS output. |
| mysql.myisam.key_buffer_bytes_unflushed | bytes | MyISAM key buffer bytes unflushed. |
| mysql.myisam.key_buffer_bytes_used | bytes | MyISAM key buffer bytes used. |
| mysql.myisam.key_buffer_size | bytes | Size of the buffer used for index blocks. |
| mysql.myisam.key_read_requests | reads/second | The number of requests to read a key block from the MyISAM key cache. |
| mysql.myisam.key_reads | reads/second | The number of physical reads of a key block from disk into the MyISAM key cache. If Key_reads is large, then your key_buffer_size value is probably too small. The cache miss rate can be calculated as Key_reads/Key_read_requests. |
| mysql.myisam.key_write_requests | writes/second | The number of requests to write a key block to the MyISAM key cache. |
| mysql.myisam.key_writes | writes/second | The number of physical writes of a key block from the MyISAM key cache to disk. |
| mysql.net.aborted_clients | connections/second | The number of connections that were aborted because the client died without closing the connection properly. |
| mysql.net.aborted_connects | connections/second | The number of failed attempts to connect to the MySQL server. |
| mysql.net.connections | connections/second | The rate of connections to the server. |
| mysql.net.max_connections | connections | The maximum number of connections that have been in use simultaneously since the server started. |
| mysql.net.max_connections_available | connections | The maximum permitted number of simultaneous client connections. |
| mysql.performance.bytes_received | bytes/second | The number of bytes received from all clients. |
| mysql.performance.bytes_sent | bytes/second | The number of bytes sent to all clients. |
| mysql.performance.com_delete | queries/second | The rate of delete statements. |
| mysql.performance.com_delete_multi | queries/second | The rate of delete-multi statements. |
| mysql.performance.com_insert | queries/second | The rate of insert statements. |
| mysql.performance.com_insert_select | queries/second | The rate of insert-select statements. |
| mysql.performance.com_load | queries/second | The rate of load statements. |
| mysql.performance.com_replace | queries/second | The rate of replace statements. |
| mysql.performance.com_replace_select | queries/second | The rate of replace-select statements. |
| mysql.performance.com_select | queries/second | The rate of select statements. |
| mysql.performance.com_update | queries/second | The rate of update statements. |
| mysql.performance.com_update_multi | queries/second | The rate of update-multi. |
| mysql.performance.created_tmp_disk_tables | tables/second | The rate of internal on-disk temporary tables created by second by the server while executing statements. |
| mysql.performance.created_tmp_files | files/second | The rate of temporary files created by second. |
| mysql.performance.created_tmp_tables | tables/second | The rate of internal temporary tables created by second by the server while executing statements. |
| mysql.performance.digest_95th_percentile.avg_us | microseconds | Query response time 95th percentile per schema. |
| mysql.performance.handler_commit | operations/second | The number of internal COMMIT statements. |
| mysql.performance.handler_delete | operations/second | The number of internal DELETE statements. |
| mysql.performance.handler_prepare | operations/second | The number of internal PREPARE statements. |
| mysql.performance.handler_read_first | operations/second | The number of internal READ_FIRST statements. |
| mysql.performance.handler_read_key | operations/second | The number of internal READ_KEY statements. |
| mysql.performance.handler_read_next | operations/second | The number of internal READ_NEXT statements. |
| mysql.performance.handler_read_prev | operations/second | The number of internal READ_PREV statements. |
| mysql.performance.handler_read_rnd | operations/second | The number of internal READ_RND statements. |
| mysql.performance.handler_read_rnd_next | operations/second | The number of internal READ_RND_NEXT statements. |
| mysql.performance.handler_rollback | operations/second | The number of internal ROLLBACK statements. |
| mysql.performance.handler_update | operations/second | The number of internal UPDATE statements. |
| mysql.performance.handler_write | operations/second | The number of internal WRITE statements. |
| mysql.performance.kernel_time | percent | Percentage of CPU time spent in kernel space by MySQL. |
| mysql.performance.key_cache_utilization | fractions | The key cache utilization ratio. |
| mysql.performance.open_files | files | The number of open files. |
| mysql.performance.open_tables | tables | The number of of tables that are open. |
| mysql.performance.opened_tables | tables/second | The number of tables that have been opened. If Opened_tables is big, your table_open_cache value is probably too small. |
| mysql.performance.qcache.utilization | fractions | Fraction of the query cache memory currently being used. |
| mysql.performance.qcache_free_blocks | blocks | The number of free memory blocks in the query cache. |
| mysql.performance.qcache_free_memory | bytes | The amount of free memory for the query cache. |
| mysql.performance.qcache_hits | hits/second | The rate of query cache hits. |
| mysql.performance.qcache_inserts | queries/second | The number of queries added to the query cache. |
| mysql.performance.qcache_lowmem_prunes | queries/second | The number of queries that were deleted from the query cache because of low memory. |
| mysql.performance.qcache_not_cached | queries/second | The number of noncached queries (not cacheable, or not cached due to the query_cache_type setting). |
| mysql.performance.qcache_queries_in_cache | queries | The number of queries registered in the query cache. |
| mysql.performance.qcache_size | bytes | The amount of memory allocated for caching query results. |
| mysql.performance.qcache_total_blocks | blocks | The total number of blocks in the query cache. |
| mysql.performance.queries | queries/second | The rate of queries. |
| mysql.performance.query_run_time.avg | microseconds | Avg query response time per schema. |
| mysql.performance.questions | queries/second | The rate of statements executed by the server. |
| mysql.performance.select_full_join | operations/second | The number of joins that perform table scans because they do not use indexes. If this value is not 0, you should carefully check the indexes of your tables. |
| mysql.performance.select_full_range_join | operations/second | The number of joins that used a range search on a reference table. |
| mysql.performance.select_range | operations/second | The number of joins that used ranges on the first table. This is normally not a critical issue even if the value is quite large. |
| mysql.performance.select_range_check | operations/second | The number of joins without keys that check for key usage after each row. If this is not 0, you should carefully check the indexes of your tables. |
| mysql.performance.select_scan | operations/second | The number of joins that did a full scan of the first table. |
| mysql.performance.slow_queries | queries/second | The rate of slow queries. |
| mysql.performance.sort_merge_passes | operations/second | The number of merge passes that the sort algorithm has had to do. If this value is large, you should consider increasing the value of the sort_buffer_size system variable. |
| mysql.performance.sort_range | operations/second | The number of sorts that were done using ranges. |
| mysql.performance.sort_rows | operations/second | The number of sorted rows. |
| mysql.performance.sort_scan | operations/second | The number of sorts that were done by scanning the table. |
| mysql.performance.table_cache_hits | hits/second | The number of hits for open tables cache lookups. |
| mysql.performance.table_cache_misses | misses/second | The number of misses for open tables cache lookups. |
| mysql.performance.table_locks_immediate | The number of times that a request for a table lock could be granted immediately. | |
| mysql.performance.table_locks_waited | The total number of times that a request for a table lock could not be granted immediately and a wait was needed. | |
| mysql.performance.table_open_cache | The number of open tables for all threads. Increasing this value increases the number of file descriptors that mysqld requires. | |
| mysql.performance.thread_cache_size | bytes | How many threads the server should cache for reuse. When a client disconnects, the client’s threads are put in the cache if there are fewer than thread_cache_size threads there. |
| mysql.performance.threads_cached | threads | The number of threads in the thread cache. |
| mysql.performance.threads_connected | connections | The number of currently open connections. |
| mysql.performance.threads_created | threads | The number of threads created to handle connections. If Threads_created is big, you may want to increase the thread_cache_size value. |
| mysql.performance.threads_running | threads | The number of threads that are not sleeping. |
| mysql.performance.user_time | percent | Percentage of CPU time spent in user space by MySQL. |
| mysql.queries.count | queries | The total count of executed queries per query per schema. This metric is only available as part of the Deep Database Monitoring ALPHA. |
| mysql.queries.errors | errors | The total count of queries run with an error per query per schema. This metric is only available as part of the Deep Database Monitoring ALPHA. |
| mysql.queries.lock_time | nanoseconds | The total time spent waiting on locks per query per schema. This metric is only available as part of the Deep Database Monitoring ALPHA. |
| mysql.queries.no_good_index_used | queries | The total count of queries which used a sub-optimal index per query per schema. This metric is only available as part of the Deep Database Monitoring ALPHA. |
| mysql.queries.no_index_used | queries | The total count of queries which do not use an index per query per schema. This metric is only available as part of the Deep Database Monitoring ALPHA. |
| mysql.queries.rows_affected | rows | The number of rows mutated per query per schema. This metric is only available as part of the Deep Database Monitoring ALPHA. |
| mysql.queries.rows_examined | rows | The number of rows examined per query per schema. This metric is only available as part of the Deep Database Monitoring ALPHA. |
| mysql.queries.rows_sent | rows | The number of rows sent per query per schema. This metric is only available as part of the Deep Database Monitoring ALPHA. |
| mysql.queries.select_full_join | The total count of full table scans on a joined table per query per schema. This metric is only available as part of the Deep Database Monitoring ALPHA. | |
| mysql.queries.select_scan | The total count of full table scans on the first table per query per schema. This metric is only available as part of the Deep Database Monitoring ALPHA. | |
| mysql.queries.time | nanoseconds | The total query execution time per query per schema. This metric is only available as part of the Deep Database Monitoring ALPHA. |
| mysql.replication.replicas_connected | Number of replicas connected to a replication source. | |
| mysql.replication.seconds_behind_master | seconds | The lag in seconds between the master and the slave. |
| mysql.replication.slave_running | Deprecated. Use service check mysql.replication.replica_running instead. A boolean showing if this server is a replication slave / master that is running. | |
| mysql.replication.slaves_connected | Deprecated. Use mysql.replication.replicas_connected instead. Number of slaves connected to a replication master. |
Step 1 – Install Datadog Agent in Centos OR Ubuntu OR Windows
The MySQL check is included in the Datadog Agent package. No additional installation is needed on your MySQL server.
Step 2 – Install and Configure Mysql Server in Centos
- How to Install MySQL on CentOS 7
- https://www.devopsschool.com/blog/how-to-install-mysql-server-and-client-on-ubuntu/
- Alternate – You may use XAMPP as well. How to install and Configure XAMPP on Ubuntu?
- How to Install & configure Xampp with mysql in Linux?
Step 3 – Prepare MySQL. On each MySQL server, create a database user for the Datadog Agent:
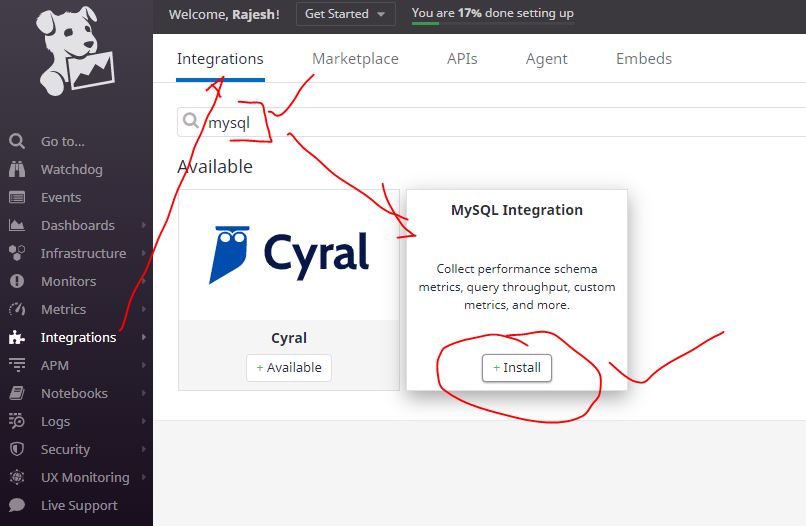
# How to login mysql server?
$ mysql -h localhost -u root -p

mysql> CREATE USER 'datadog'@'localhost' IDENTIFIED BY '<UNIQUEPASSWORD>';
Query OK, 0 rows affected (0.00 sec)

For mySQL 8.0+ create the datadog user with the native password hashing method:

mysql> CREATE USER 'datadog'@'localhost' IDENTIFIED WITH mysql_native_password by '<UNIQUEPASSWORD>';
Query OK, 0 rows affected (0.00 sec)

Note: @'localhost' is only for local connections - use the hostname/IP of your Agent for remote connections. For more information, see the MySQL documentation.

Verify the user was created successfully using the following commands - replace <UNIQUEPASSWORD> with the password you created above:

mysql -u datadog --password=<UNIQUEPASSWORD> -e "show status" | \
grep Uptime && echo -e "\033[0;32mMySQL user - OK\033[0m" || \
echo -e "\033[0;31mCannot connect to MySQL\033[0m"

mysql -u datadog --password=<UNIQUEPASSWORD> -e "show slave status" && \
echo -e "\033[0;32mMySQL grant - OK\033[0m" || \
echo -e "\033[0;31mMissing REPLICATION CLIENT grant\033[0m"Code language: PHP (php)
Step 4 – The Agent needs a few privileges to collect metrics. Grant the user the following limited privileges ONLY:
mysql> GRANT REPLICATION CLIENT ON *.* TO 'datadog'@'localhost' WITH MAX_USER_CONNECTIONS 5;
Query OK, 0 rows affected, 1 warning (0.00 sec)

mysql> GRANT PROCESS ON *.* TO 'datadog'@'localhost';
Query OK, 0 rows affected (0.00 sec)

For MySQL 8.0+ set max_user_connections with:

mysql> ALTER USER 'datadog'@'localhost' WITH MAX_USER_CONNECTIONS 5;
Query OK, 0 rows affected (0.00 sec)

If enabled, metrics can be collected from the performance_schema database by granting an additional privilege:

mysql> show databases like 'performance_schema';
+-------------------------------+
| Database (performance_schema) |
+-------------------------------+
| performance_schema            |
+-------------------------------+
1 row in set (0.00 sec)

mysql> GRANT SELECT ON performance_schema.* TO 'datadog'@'localhost';
Query OK, 0 rows affected (0.00 sec)Code language: PHP (php)
Step 5 – Configure Datadog agent to start collection mysql metrix.
Edit the mysql.d/conf.yaml file, in the conf.d/ folder at the root of your Agent’s configuration directory to start collecting your MySQL metrics and logs. See the sample mysql.d/conf.yaml for all available configuration options.
$ cd /etc/datadog-agent/conf.d/mysql.d/
$ sudo cp conf.yaml.example conf.yaml
$ sudo vi conf.yaml (CHECK IMAGE BELOW)
$ sudo service datadog-agent restart [UBUNTU]
$ sudo systemctl restart datadog-agent [Centos]


Metric collection
Add this configuration block to your mysql.d/conf.yaml to collect your MySQL metrics:

init_config:

instances:
  - server: 127.0.0.1
    user: datadog
    pass: "<YOUR_CHOSEN_PASSWORD>" # from the CREATE USER step earlier
    port: "<YOUR_MYSQL_PORT>" # e.g. 3306
    options:
      replication: false
      galera_cluster: true
      extra_status_metrics: true
      extra_innodb_metrics: true
      extra_performance_metrics: true
      schema_size_metrics: false
      disable_innodb_metrics: false
Note: Wrap your password in single quotes in case a special character is present.Code language: PHP (php)
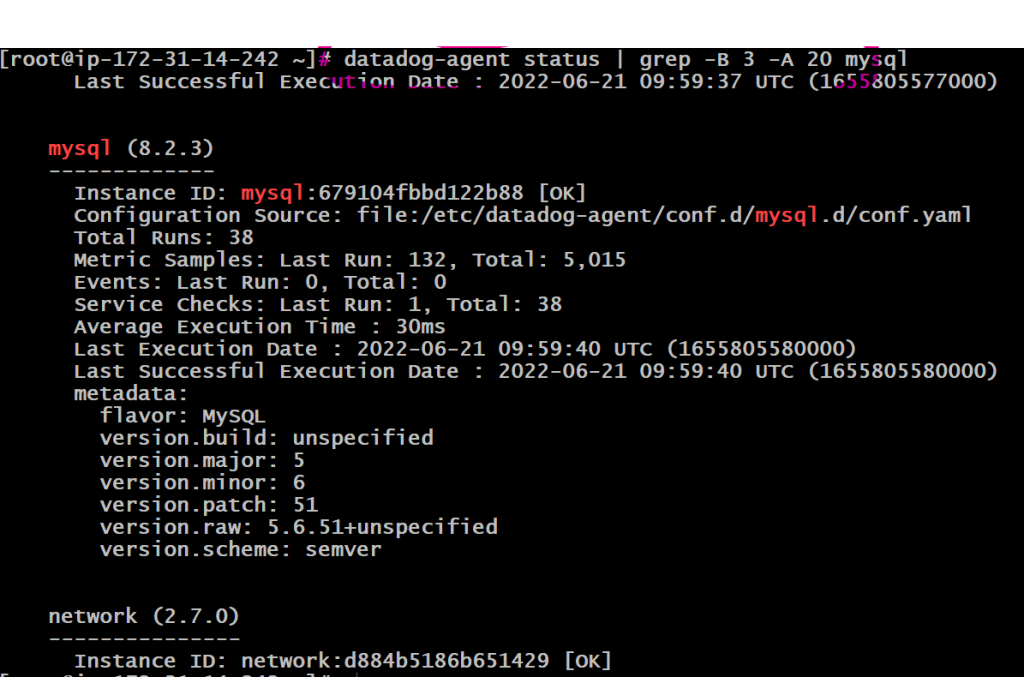
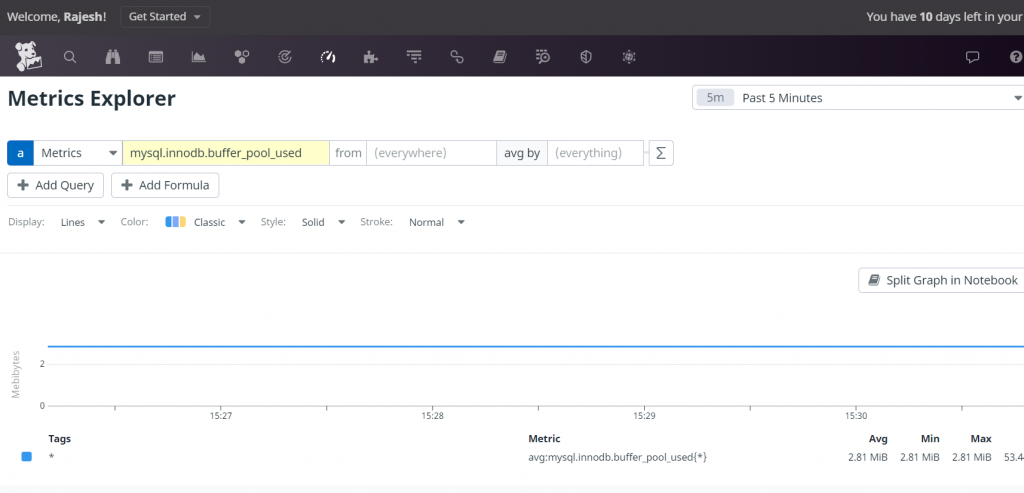
Step 5 – Validate mysql metrices
$ systemctl restart datadog-agent
$ datadog-agent status
MariaDB changes
mysql> CREATE USER 'datadog'@'%' IDENTIFIED BY 'Raju$123456';

mysql> GRANT REPLICATION CLIENT ON *.* TO 'datadog'@'%'
Query OK, 0 rows affected (0.00 sec)

mysql> ALTER USER 'datadog'@'%' WITH MAX_USER_CONNECTIONS 5;
Query OK, 0 rows affected (0.00 sec)

mysql> GRANT PROCESS ON *.* TO 'datadog'@'%';
Query OK, 0 rows affected (0.00 sec)

mysql> show databases like 'performance_schema';
+-------------------------------+
| Database (performance_schema) |
+-------------------------------+
| performance_schema            |
+-------------------------------+
1 row in set (0.00 sec)

mysql> GRANT SELECT ON performance_schema.* TO 'datadog'@'%';
Code language: PHP (php)
I’m Rajesh Kumar, a DevOps, SRE, DevSecOps, Cloud, and Platform Engineering expert passionate about sharing practical knowledge, real-world experiences, and industry best practices. I have worked at Cotocus and regularly write about technology, travel, investing, health, product reviews, and digital marketing through my various platforms.
I publish technical articles at DevOps School, travel stories at Holiday Landmark, stock market insights at Stocks Mantra, health and fitness guidance at My Medic Plus, product reviews at TrueReviewNow, and SEO and digital marketing strategies at Wizbrand.
Find Trusted Cardiac Hospitals
Compare heart hospitals by city and services — all in one place.
Explore Hospitals