
Top 10 Alerting & Monitoring Tools in 2026: Features, Pros, Cons & Comparison
Introduction In today’s fast-paced, digital-first business world, Alerting & Monitoring Tools have become essential for ensuring the smooth operation of complex systems. Whether it’s for network infrastructure,…
World’s Top 5 Best Real User Monitoring (RUM) Tools
The 2026 Guide to Real User Monitoring (RUM): What It Is, Key Benefits, Essential Features & the Top 5 Tools Compared What is Real User Monitoring (RUM)?…
World’s Top 5 Best BGP Monitoring Tools
What is BGP Monitoring? Border Gateway Protocol (BGP) Monitoring refers to the ongoing process of observing and analyzing the routing information exchanged between networks over the internet…
Synthetic Monitoring: Key Features & Top 10 Synthetic Tools & Its Comparison
What is Synthetic Monitoring? Synthetic Monitoring—sometimes called active monitoring—is a technique used by IT teams and digital businesses to proactively test website, application, and API performance. Unlike…
What is the Best alternate of Sentry
If you’re exploring alternatives to Sentry, there are many tools that offer error tracking, logging, performance monitoring, or observability — depending on what you’re looking for. Let…
AppDynamics Joins the Splunk Observability Portfolio
Based on the official information from Splunk’s June 2026 update, here’s a crystal-clear breakdown of the current relationship and distinction between Splunk AppDynamics and the Splunk Observability…
Code Coverage Tutorials: Main types of code coverage metrics
Here’s a comprehensive list of the main types of code coverage metrics used in software testing, ranging from basic to advanced: ✅ 1. C0: Line Coverage (Statement…
Gitlab – Guide to Generating DORA Metrics in GitLab
GitLab 18.x Ultimate provides native support for all four DORA metrics via its REST API, giving engineering teams deep insights into the performance and reliability of their…
Step by Step guide to correctly create alerts via New Relic API
Here’s a step-by-step guide to correctly create alerts via New Relic API, with proper handling of: This will help you avoid common errors like using the wrong…
New Relic API Guide – Step-by-Step Tutorial with Example
Here is a step-by-step tutorial on how to work with the New Relic API, including how to create an alert condition using the API. 🚀 New Relic…
New Relic Log Search Tutorial with Examples
Here is a comprehensive tutorial for New Relic Log Search covering all the items you’ve listed, with real-world examples specifically tailored for Linux and Apache logs. The…
Why Your Games Run Clearly with the ELK Stack
Learn how ELK Stack tools like Logstash, Elasticsearch, and Kibana help developers detect and resolve gameplay lags and freezes across all platforms. How the ELK Stack Helps…
Rundeck Basic Workflow: Step-by-Step
Here’s a clear explanation of the Rundeck Basic Workflow, perfect for beginners or teams implementing Rundeck for the first time. 🔄 Rundeck Basic Workflow: Step-by-Step This describes…
About Elastic (The Company)
Certainly! Here’s a detailed overview of Elastic N.V. (commonly known as Elastic, the company behind Elasticsearch), covering its transformation, history, key milestones, product evolution, and major release…
How to install kibana and configure with Elasticsearch
Download & Extract kibana 8.x Configure kibana 8.x Download, Extract, Install and Configure kibana 9.x vi config/kibana.yml ./bin/kibana –allow-root Provide Enrollment Kye of ElasticSearch Login to Kibana…
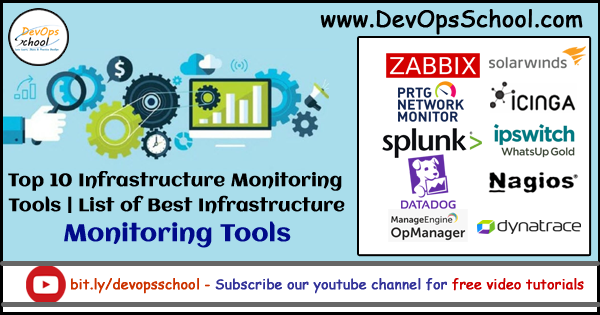
Top 10 Infrastructure Monitoring Tools
Introduction As a network grows, finding and ensuring the Best IT Infrastructure Monitoring Tools and Software for your Business is critical in today’s complex and ever-growing eco-system…
Dynatrace Sample Application for Demo and Lab using easyTravel & EasyTrade
easyTravel Demo Application in Docker This project builds and deploys the Dynatrace easyTravel demo application in Docker. All components are readily available on the Docker Hub.URL –…
Improving performance visibility in modern advertising systems
Observability and monitoring are essential in the rapidly evolving ad tech landscape. Without them, performance bottlenecks can remain hidden, leading to costly downtime and lost revenue. DevOps…
Dynatrace Tutorials: Oneagent Command line & Configuration
Dynatrace Oneagent configuration file location The location of the Dynatrace OneAgent configuration file can vary depending on the operating system and installation method. In general, the configuration…
Dynatrace architecture: core components and deployment patterns
Dynatrace Architecture and Components: A Comprehensive Guide Introduction Dynatrace is a full-stack observability platform designed to monitor, analyze, and optimize the performance of applications, infrastructure, and user…
Dynatrace Architecture and Components: A Comprehensive Guide
Dynatrace Architecture and Components: A Comprehensive Guide Introduction Dynatrace is a full-stack observability platform designed to monitor, analyze, and optimize the performance of applications, infrastructure, and user…
Dynatrace OneAgent Monitoring Mode
Dynatrace OneAgent Monitoring Modes define how deeply OneAgent monitors your systems, depending on the level of access and the environment it’s running in. These modes let you…
Join Our Upcoming Batch at DevOpsSchool: Master in Dynatrace
🚀 Join Our Upcoming Batch at DevOpsSchool: Master in Dynatrace! 🚀 Hello DevOps Enthusiasts! 📌 Mark Your Calendars! We are excited to announce that DevOpsSchool is launching…
ELK Demo Tutorial
Demo Video Sure! Here’s a compelling promotional content piece that highlights both the Intermediate and Advanced ELK (Elasticsearch, Logstash, Kibana) training courses by Rajesh Kumar, available at…
New Relic Certified Performance Engineer – Professional (PEP) Comprehensive Guide
Overview The New Relic Certified Performance Engineer – Professional (PEP) certification is designed for experienced engineers, developers, and operations professionals who are responsible for measuring, analyzing, and…
New Relic Certified Reliability Engineer – Professional (REP) Comprehensive Guide
Overview The New Relic Certified Reliability Engineer – Professional (REP) certification is designed for experienced engineers who are responsible for ensuring the reliability, scalability, and availability of…
New Relic Certified APM Practitioner – Associate (APA) Comprehensive Guide
This exam validates candidates’ knowledge of New Relic APM fundamentals, user interface and navigation, understanding insights for performance analysis, triage and troubleshooting techniques, and methods for tracking…
Grafana Demo Video
Sure! Here’s a one-page promotional content that introduces and highlights the Grafana Essentials, Intermediate, and Advanced training programs offered by DevOpsSchool: Master Grafana from Basics to Advanced…
What is Sentry?
What is Sentry? Sentry is a powerful open-source application monitoring and error tracking tool designed to help developers detect, diagnose, and resolve issues in real-time across web…
Appdynamics Demo Video
Rajesh KumarI’m Rajesh Kumar, a DevOps, SRE, DevSecOps, Cloud, and Platform Engineering expert passionate about sharing practical knowledge, real-world experiences, and industry best practices. I have worked…