
Prometheus PromQL Example Query: node exporter
For your Linux Node Exporter target, these are the most important PromQL queries for CPU, RAM, Disk, Network, Load, Uptime. Your uploaded metrics include Node Exporter metrics…

Install and Configure Prometheus Server and Node Exporter in Linux
There are 3 importants components to make sure Prometheus is up and running. We need to install and configure Prerequisite Prometheus Errors & Solution https://www.scmgalaxy.com/tutorials/prometheus-errors-solution Install and…
Master Monitoring with Prometheus and Grafana Training in Hyderabad
Introduction Have you ever wondered how big companies keep their websites and apps running smoothly without problems? When you shop online or use a banking app, there…
Master Monitoring with Prometheus & Grafana Training in Chennai
Introduction In today’s fast-moving world of software and IT, keeping a close watch on your systems is not just helpful—it is essential. Think about it: when a…
Master Modern Monitoring: Prometheus and Grafana Training in Bangalore
Introduction Have you ever felt like you’re flying blind when managing your software applications? Imagine a car without a dashboard—no speedometer, no fuel gauge, no warning lights….
What is Prometheus and use cases of Prometheus?
What is Prometheus? Prometheus is an open-source monitoring and alerting toolkit designed for reliability and scalability. It is particularly well-suited for monitoring dynamic, cloud-native environments. Prometheus focuses…
How to deploy Prometheus & Grafana in Kubernetes?
Prometheus Stack The Prometheus stack typically includes several components that work together to provide comprehensive monitoring and alerting capabilities for your infrastructure and applications. Here’s a table…
Grafana Tutorials: Display Jenkins Build Status on Grafana using prometheus?
Step – 1: Install Grafana server Step – 2: Install Jenkins Server Step – 3: Install prometheus Server? Jenkins Prometheus Plugin expose an endpoint (default /prometheus) with…
Topics to learn in Prometheus with Grafana Training
1. Introduction – Prometheus Introduction to Prometheus Prometheus installation Grafana with Prometheus Installation 2. Monitoring Introduction to Monitoring Client Libraries Pushing Metrics Querying Service Discovery Exporters 3….
Using Expression browser in Prometheus
The expression browser is available at /graph on the Prometheus server, allowing you to enter any expression and see its result either in a table or graphed…
How to Install Windows Exporter for prometheus?
Prerequisite Step 1 – Download and Install Windows Exporter https://prometheus.io/docs/instrumenting/exporters/ https://github.com/prometheus-community/windows_exporter https://github.com/prometheus-community/windows_exporter/releases windows_exporter-0.16.0-amd64.msi – Installed with Services windows_exporter-0.16.0-amd64.exe – Run Adhoc on the screen Step 2 –…

Install and Configure Prometheus for Collecting Docker metrics
How to install Install Docker Configure docker for exposing a Metrices at end point To configure the Docker daemon as a Prometheus target, you need to specify…
Install and Configure Prometheus MySQL Exporter
Step 1 – Add Prometheus system user and group: Step 2 – Download and install Prometheus MySQL Exporter This should be done on MySQL / MariaDB servers,…
Interview Questions & Answer for Prometheus
What is Prometheus? What are some of Prometheus’s main features? Describe Prometheus architecture and components Can you compare Prometheus to other solutions like InfluxDB for example? What…
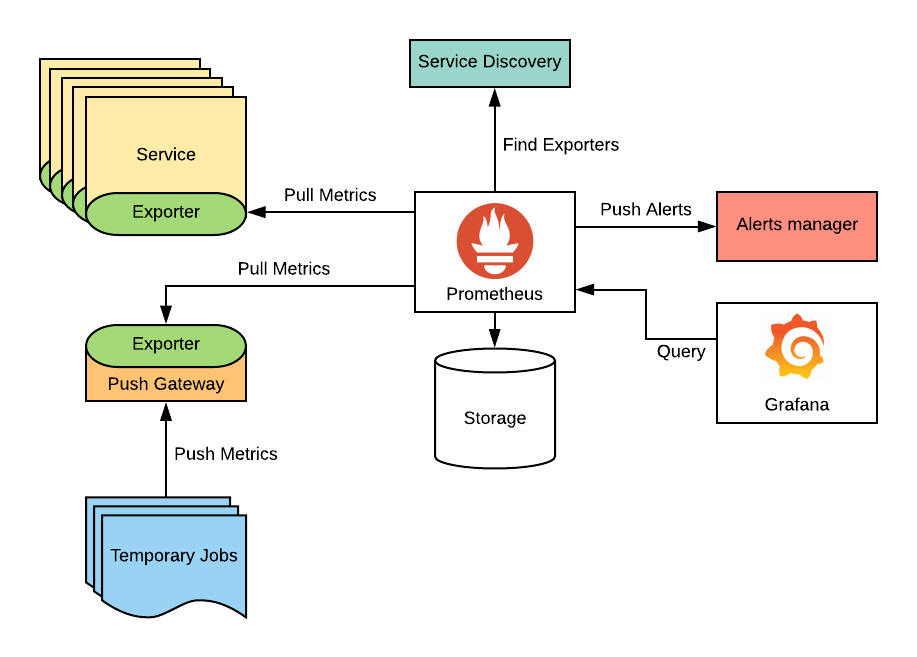
What is Prometheus and How it works?
Meaning of Prometheus In Greek mythology, Prometheus, possibly meaning “forethought”), is a Titan god of fire. Prometheus is known for his intelligence and for being a champion…