
Introduction
Data observability tools are specialized platforms designed to help organizations understand, monitor, and trust their data across complex data pipelines. As modern businesses increasingly rely on data-driven decisions, the volume, velocity, and variety of data have grown dramatically. This complexity introduces risks such as data downtime, schema changes, freshness issues, and silent data quality failures that traditional monitoring tools often miss.
Data observability focuses on detecting, diagnosing, and resolving data issues proactively by providing deep visibility into data health. These tools analyze metadata, lineage, freshness, volume, distribution, and anomalies to ensure that data is accurate, timely, and reliable.
In real-world scenarios, data observability tools are used to:
- Detect broken ETL/ELT pipelines before stakeholders notice
- Identify anomalies in business metrics caused by upstream data issues
- Ensure compliance and auditability in regulated industries
- Improve trust between data teams and business users
When evaluating data observability tools, users should look for:
- Breadth of data health metrics (freshness, volume, schema, distribution)
- Automation and anomaly detection capabilities
- Integration with modern data stacks
- Ease of implementation and usability
- Scalability, security, and cost efficiency
Best for:
Data observability tools are ideal for data engineers, analytics engineers, data scientists, BI teams, platform teams, and data-driven business leaders. They are widely used in mid-sized to large organizations, SaaS companies, fintech, healthcare, e-commerce, logistics, and enterprises operating modern cloud data platforms.
Not ideal for:
Very small teams with simple data pipelines, early-stage startups without analytics maturity, or organizations relying entirely on manual data validation may find these tools excessive. In such cases, basic data quality checks or custom scripts may be sufficient.
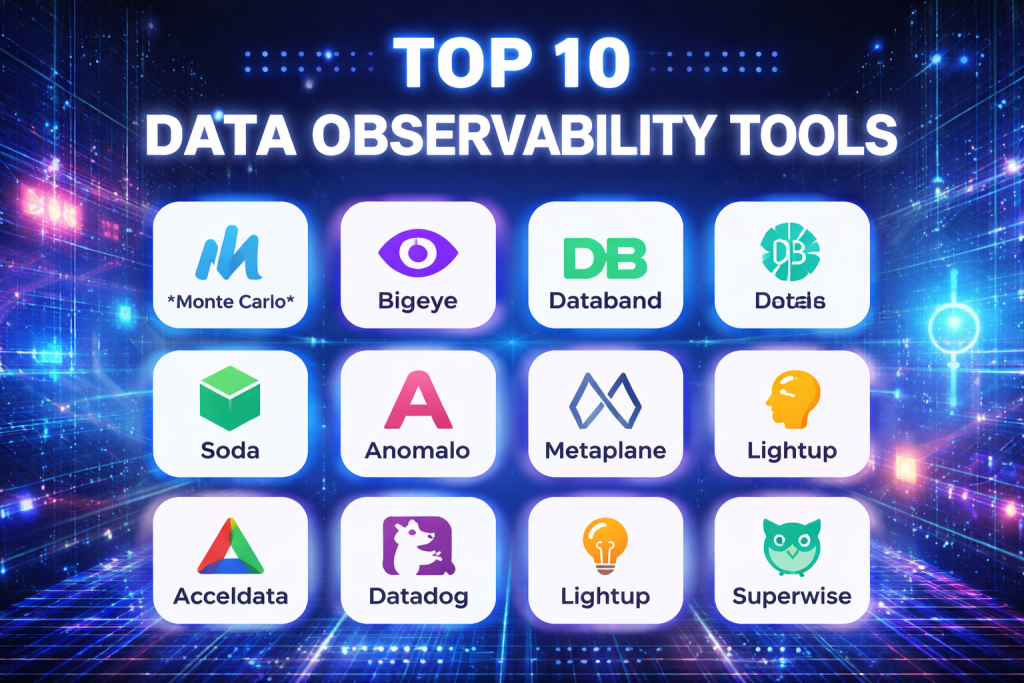
Top 10 Data Observability Tools
1 — Monte Carlo
Short description:
Monte Carlo is a leading data observability platform focused on preventing data downtime in modern cloud data stacks. It is widely adopted by data-driven enterprises.
Key features:
- End-to-end data observability across pipelines
- Automated anomaly detection on freshness, volume, and distribution
- Column-level lineage and impact analysis
- Root cause analysis with upstream/downstream tracing
- Data quality monitoring without manual rule writing
- Integration with cloud data warehouses
- Incident management workflows
Pros:
- Strong automation with minimal configuration
- Excellent root cause analysis capabilities
- Scales well for large data ecosystems
Cons:
- Premium pricing
- Can be complex for very small teams
Security & compliance:
SSO, role-based access control, encryption in transit and at rest, SOC 2 compliant
Support & community:
Enterprise-grade support, onboarding assistance, strong documentation, active customer base
2 — Bigeye
Short description:
Bigeye provides data observability and quality monitoring with a focus on enterprise governance and reliability.
Key features:
- Data quality rules and anomaly detection
- Business metric monitoring
- Lineage visualization
- SLA and freshness tracking
- SQL-based rule authoring
- Alerting and reporting
- Data trust dashboards
Pros:
- Strong enterprise governance features
- Flexible rule-based monitoring
- Good support for business metrics
Cons:
- More manual configuration than some competitors
- UI can feel dense
Security & compliance:
SSO, audit logs, encryption, SOC 2, GDPR-ready
Support & community:
Dedicated enterprise support, professional onboarding, comprehensive documentation
3 — Databand
Short description:
Databand focuses on pipeline observability and operational monitoring for data engineering teams.
Key features:
- Pipeline-level observability
- Job execution monitoring
- Data freshness and volume checks
- Impact analysis for failures
- Integration with orchestration tools
- Alerting and incident workflows
Pros:
- Strong for operational data teams
- Good orchestration integrations
- Clear incident diagnostics
Cons:
- Less focus on business metrics
- Limited advanced analytics visibility
Security & compliance:
Encryption, RBAC, SOC 2 (varies by deployment)
Support & community:
Solid documentation, enterprise support, onboarding assistance
4 — Soda
Short description:
Soda offers an open and flexible data observability approach with both open-source and commercial options.
Key features:
- Open-source data quality framework
- Data profiling and checks
- Custom rule definitions
- Cloud-based observability dashboards
- Integration with modern data warehouses
- CI/CD-friendly workflows
Pros:
- Open-source flexibility
- Transparent and customizable
- Suitable for engineering-focused teams
Cons:
- Requires more setup and maintenance
- UI less polished than premium tools
Security & compliance:
Varies by deployment, supports encryption and RBAC
Support & community:
Active open-source community, documentation, paid enterprise support available
5 — Anomalo
Short description:
Anomalo specializes in automated data quality and anomaly detection without requiring manual rules.
Key features:
- Machine-learning-based anomaly detection
- Column-level data quality monitoring
- Schema and distribution change detection
- Data drift monitoring
- Integration with cloud data platforms
- Automated alerts
Pros:
- Minimal configuration required
- Strong ML-driven insights
- Good for fast-growing data teams
Cons:
- Less control over custom rules
- Focused primarily on quality rather than full observability
Security & compliance:
SSO, encryption, SOC 2 compliance
Support & community:
Responsive customer support, guided onboarding, growing user base
6 — Metaplane
Short description:
Metaplane is a modern data observability platform emphasizing ease of use and fast time-to-value.
Key features:
- Automatic anomaly detection
- Data lineage mapping
- Incident timelines
- Integration with modern data tools
- Collaborative incident resolution
- Lightweight setup
Pros:
- Intuitive user experience
- Fast deployment
- Strong collaboration features
Cons:
- Fewer advanced enterprise controls
- Limited customization for complex needs
Security & compliance:
SSO, encryption, SOC 2
Support & community:
Good documentation, responsive support, smaller but active community
7 — Acceldata
Short description:
Acceldata provides enterprise-grade data observability across batch and streaming data pipelines.
Key features:
- End-to-end pipeline observability
- Streaming and batch monitoring
- Data quality and performance analytics
- Metadata management
- SLA tracking
- Enterprise reporting
Pros:
- Strong scalability
- Deep enterprise features
- Supports complex architectures
Cons:
- Higher learning curve
- Premium pricing model
Security & compliance:
Enterprise security controls, SOC 2, GDPR, audit logs
Support & community:
Dedicated enterprise support, training, strong onboarding
8 — Datadog Data Observability
Short description:
Datadog extends its observability platform to cover data pipelines and analytics workloads.
Key features:
- Pipeline monitoring
- Data freshness checks
- Unified observability with infrastructure
- Alerting and dashboards
- Integration with cloud ecosystems
- Metrics correlation
Pros:
- Unified observability platform
- Strong monitoring ecosystem
- Familiar interface for Datadog users
Cons:
- Less specialized than dedicated tools
- Pricing can escalate quickly
Security & compliance:
SOC 2, ISO, GDPR, encryption, RBAC
Support & community:
Extensive documentation, large community, enterprise support options
9 — Lightup
Short description:
Lightup focuses on automated data observability and lineage with minimal manual effort.
Key features:
- Automated lineage mapping
- Anomaly detection
- Freshness and volume monitoring
- Impact analysis
- Cloud-native architecture
- Alerting workflows
Pros:
- Automated lineage is a strong differentiator
- Easy to get started
- Good visualization capabilities
Cons:
- Smaller ecosystem
- Fewer integrations than larger platforms
Security & compliance:
Encryption, RBAC, SOC 2 (varies)
Support & community:
Responsive support, improving documentation, growing adoption
10 — Superwise
Short description:
Superwise blends data observability with ML model monitoring for data science-heavy organizations.
Key features:
- Data and ML observability
- Feature drift detection
- Data quality monitoring
- Model performance tracking
- Alerting and analytics
- Enterprise dashboards
Pros:
- Strong ML observability integration
- Useful for AI-driven organizations
- Advanced analytics insights
Cons:
- Overkill for non-ML teams
- More complex setup
Security & compliance:
SSO, encryption, enterprise security standards
Support & community:
Enterprise support, documentation, specialized ML-focused guidance
Comparison Table
| Tool Name | Best For | Platform(s) Supported | Standout Feature | Rating |
|---|---|---|---|---|
| Monte Carlo | Enterprise data teams | Cloud data stacks | Root cause analysis | N/A |
| Bigeye | Governance-focused orgs | Cloud & hybrid | Business metric monitoring | N/A |
| Databand | Data engineers | Cloud pipelines | Pipeline observability | N/A |
| Soda | Engineering teams | Cloud & open-source | Open-source flexibility | N/A |
| Anomalo | Fast-growing teams | Cloud data platforms | ML-driven quality checks | N/A |
| Metaplane | Mid-market teams | Cloud | Ease of use | N/A |
| Acceldata | Large enterprises | Cloud & hybrid | Streaming observability | N/A |
| Datadog | Unified observability users | Multi-platform | Platform unification | N/A |
| Lightup | Metadata-driven teams | Cloud | Automated lineage | N/A |
| Superwise | ML-heavy orgs | Cloud | ML + data observability | N/A |
Evaluation & Scoring of Data Observability Tools
| Criteria | Weight | Description |
|---|---|---|
| Core features | 25% | Breadth of observability and quality metrics |
| Ease of use | 15% | Setup, UI, learning curve |
| Integrations & ecosystem | 15% | Compatibility with modern data stacks |
| Security & compliance | 10% | Enterprise-grade security readiness |
| Performance & reliability | 10% | Scalability and uptime |
| Support & community | 10% | Documentation and customer success |
| Price / value | 15% | Cost efficiency and ROI |
Which Data Observability Tool Is Right for You?
- Solo users & small teams: Lightweight or open-source solutions like Soda are more practical.
- SMBs: Tools like Metaplane or Anomalo balance usability and power.
- Mid-market: Monte Carlo, Bigeye, or Lightup offer deeper insights with manageable complexity.
- Enterprise: Acceldata, Monte Carlo, and Datadog provide scale, governance, and security.
Budget-conscious teams should prioritize open frameworks and modular pricing, while premium buyers may value automation and enterprise support.
Choose feature depth if you manage complex pipelines; choose ease of use if speed and simplicity matter.
Integration and scalability are critical for cloud-native stacks, while regulated industries must prioritize security and compliance.
Frequently Asked Questions (FAQs)
1. What is data observability?
It is the practice of monitoring data health across pipelines to ensure accuracy, freshness, and reliability.
2. How is data observability different from data quality?
Data quality focuses on correctness, while observability includes detection, diagnosis, and root cause analysis.
3. Do small teams need data observability tools?
Not always. Simple pipelines may not justify the complexity or cost.
4. Are these tools cloud-only?
Most support cloud platforms; some offer hybrid or on-premise options.
5. How long does implementation take?
From a few hours for lightweight tools to several weeks for enterprise deployments.
6. Do these tools replace data engineers?
No. They enhance productivity and reduce firefighting.
7. Are open-source tools reliable?
Yes, but they require more maintenance and expertise.
8. How do these tools handle schema changes?
They automatically detect and alert on schema drift.
9. Are they secure for sensitive data?
Most enterprise tools follow strong security and compliance standards.
10. What is the biggest mistake buyers make?
Choosing tools without aligning them to actual data maturity and business needs.
Conclusion
Data observability tools have become essential for maintaining trust in modern data ecosystems. As data pipelines grow more complex, proactive monitoring, anomaly detection, and root cause analysis are no longer optional.
The most important factors when choosing a data observability tool are alignment with your data stack, ease of use, scalability, and security requirements. There is no single “best” tool for everyone—each platform excels in different scenarios.
By carefully evaluating your organization’s size, budget, data maturity, and long-term goals, you can select a data observability solution that not only prevents data downtime but also empowers teams to make confident, data-driven decisions.

Find Trusted Cardiac Hospitals
Compare heart hospitals by city and services — all in one place.
Explore Hospitals
Data observability tools help organizations maintain reliable data pipelines by identifying issues such as freshness delays, schema changes, unexpected volume fluctuations, and data quality problems before they affect downstream analytics. Platforms such as Monte Carlo, Bigeye, Acceldata, and Soda offer different approaches to monitoring data health and detecting anomalies across complex data environments. I believe integration with existing data infrastructure, alert accuracy, root-cause analysis, and ease of implementation are essential factors when comparing these solutions. The real value of data observability lies not just in detecting failures, but in helping teams understand their causes quickly and prevent recurring issues, ultimately building greater trust in the data used for business decisions.
Data observability tools can generate plenty of alerts, but the real test is whether teams can identify which data problems actually affect business operations. For example, a delayed pipeline feeding an executive dashboard may require immediate attention, while a similar delay in a rarely used analytical dataset might be acceptable. I would assess whether a platform supports impact-based alert prioritization, ownership routing, and incident escalation based on downstream dependencies rather than treating every anomaly equally. It is also important to track the time between detecting an issue and restoring trustworthy data, not just the number of anomalies identified. Without clear ownership and response procedures, observability can become another source of alert fatigue. The strongest implementation helps teams move from detecting unusual data behavior to resolving the underlying cause before users make decisions based on unreliable information.
Data observability tools are useful for finding data quality issues before they affect reports or business decisions. Along with checking data freshness and accuracy, teams should look at how quickly a tool can trace an issue to its source. Clear alerts and useful logs can help engineers fix problems without spending hours investigating them. I would also consider how well the tool fits existing data pipelines and keeps monitoring costs under control. How do teams decide which data issues need immediate attention and which can wait?
Data observability tools help teams find data problems before they affect reports or applications. Useful features include freshness checks, volume alerts, schema tracking, and quality rules. Buyers should compare pipeline support and integration with current systems. Good alerts should explain the problem and help teams find its source. It is also important to detect slow changes, not just sudden failures. A reliable observability platform improves trust in data and helps teams resolve issues before they spread across business systems.
Catching broken ETL pipelines and silent data quality issues before they reach business dashboards is a massive win for data engineering teams. While automated enterprise platforms offer deep root cause analysis and instant anomaly detection across massive cloud warehouses, open-source frameworks give technical teams the flexibility to build custom checks. Reviewing the feature breakdown helps you match observability depth with your data stack’s needs.
A key challenge with data observability is keeping alert thresholds useful as business activity changes. A sudden drop in orders may signal a broken pipeline on a normal day, but it could be expected during a holiday or planned outage. I would test whether monitors can account for known business cycles and distinguish expected changes from real failures. Reviewing past incidents against alert history can help teams reduce noisy warnings and catch data issues that genuinely affect downstream decisions.
Data observability tools help teams detect problems in data pipelines before missing, delayed, or incorrect information affects business reports and applications. When evaluating platforms, I would focus on freshness monitoring, schema change detection, volume anomalies, data quality checks, and the ability to trace issues back to their source. Integration with existing data warehouses, orchestration tools, and alerting systems is also important because teams need to investigate problems without switching between too many applications. Clear lineage information can reduce troubleshooting time by showing which downstream reports or services are affected by a data issue. A useful comparison should consider alert accuracy, monitoring costs, and how quickly teams can identify and resolve real pipeline failures.
Data observability tools help teams detect data quality issues, pipeline failures, schema changes, and unexpected freshness delays before they affect downstream analytics. Monitoring lineage alongside volume, distribution, and reliability metrics makes it easier to trace problems to their source and reduce investigation time. Clear alert thresholds and integration with existing data workflows also help prevent alert fatigue while maintaining trust in business-critical datasets.
One practical factor worth adding to data observability comparisons is how quickly teams can trace a data quality issue to its source and understand which downstream reports or pipelines are affected. While Monte Carlo emphasizes automated root-cause analysis and Soda offers flexible quality checks, alert accuracy and investigation effort matter just as much as detection capabilities.
Data observability tools are most useful when they help teams trace data issues back to their source before reports or models suffer. Monitoring freshness, schema changes, volume shifts, and data quality together can reveal problems that a single alert might miss. Clear ownership and well-tuned alerts also help teams fix issues faster without creating unnecessary noise.
Data observability tools are most valuable when they detect data problems before those issues affect dashboards, reports, or downstream applications. Beyond freshness checks, teams should monitor schema changes, unexpected volume shifts, and data quality across critical pipelines. Clear lineage can also help engineers trace an issue back to its source instead of spending hours investigating symptoms. I would recommend tuning alerts to reduce noise and assigning ownership for resolving each type of incident. How can teams build effective data observability without creating alert fatigue or adding unnecessary monitoring costs?
This breakdown highlights how choosing the right tool depends heavily on an organization’s scale and whether the focus is enterprise governance or core pipeline monitoring. While heavy platforms like Monte Carlo or Anomalo offer strong ML-driven automation, smaller teams might find flexible options like Soda more practical. How do you typically balance the initial configuration overhead of these tools against the frequency of data pipeline incidents.
Data observability is especially valuable when a pipeline finishes successfully but delivers incomplete or misleading results. Tracking changes in data volume, schema, and freshness can help teams find the stage where a problem first appeared. I’d also look for alerts that explain which reports or downstream jobs may be affected, so teams can focus their investigation quickly.
A common operational challenge is turning data quality alerts into clear, actionable incidents. When several downstream tables depend on one faulty upstream dataset, a single failure can trigger dozens of notifications and waste engineering time. Teams should define ownership for critical datasets, group related alerts by root cause, and set severity levels based on business impact. It also helps to connect data incidents with existing on-call workflows and track recovery time alongside alert accuracy. Before adopting a platform, I would test whether it can distinguish a genuine data failure from normal seasonal changes or delayed source updates. These practices help teams reduce alert fatigue, speed up incident resolution, and keep important business reports reliable.
Maintaining data trust requires automated observability across complex pipelines. Engineering teams must track freshness, volume anomalies, and breaking schema changes with end-to-end lineage mapping, preventing silent ETL failures from corrupting downstream production analytics dashboards.
Data observability tools help teams detect data quality issues, monitor pipeline health, and identify unexpected changes before they disrupt downstream analytics. Comparing freshness monitoring, anomaly detection, lineage tracking, and alerting capabilities offers valuable guidance for choosing solutions that improve trust in data and keep business-critical workflows running reliably.
This article offers a clear and practical comparison of the top data observability tools, helping readers understand how each platform supports data reliability, monitoring, and issue detection across complex pipelines. The breakdown of key features, strengths, and limitations makes it easier for both beginners and experienced professionals to evaluate tools based on their needs—such as alerting capabilities, integration with existing systems, and ease of use. By focusing on real-world considerations and practical differences rather than just listing names, this post serves as a valuable guide for anyone looking to improve data quality and operational observability in modern data environments. Great resource for making informed decisions!