Remote DevOps work thrives when delivery health is as easy to read as a wall-mounted dashboard, yet 64 percent of engineering managers admit they do not see how their teams actually collaborate day to day, the 2024 State of the Team report from TeamDynamics shows. Google Cloud’s 2021 Accelerate State of DevOps study echoes the cost of that blind spot, finding that elite teams deploy 973 times more often and restore service 6 570 times faster than low performers. The ten tools in this guide give your distributed engineers the same always-on telemetry that tracks lead time, change-failure rate and mean time to recovery without locking you into one monolithic platform. Skim the snapshot table, follow the three-step decision path and choose the dashboard that fits your security, budget and culture.
Full-stack engineering-intelligence suites
Most executives ask one question first: “Can we see delivery speed, quality, and business impact in a single view?” Full-stack suites say yes. They pull data from Git, CI/CD, work-item trackers, and incident logs into real-time dashboards that highlight review delays, deployment frequency, and change-failure rate. Gartner’s 2023 Hype Cycle for Software Engineering predicts that platform engineering, built around unified telemetry, will be mainstream within two to five years, and 50 percent of enterprise developers will rely on ML-assisted coding and analytics tools by 2027 (Gartner). For distributed teams, these suites feel like one shared cockpit, not a scattered set of gauges, helping your team spot risk early and ship with confidence.
TeamDynamics: unified metrics for remote rhythm
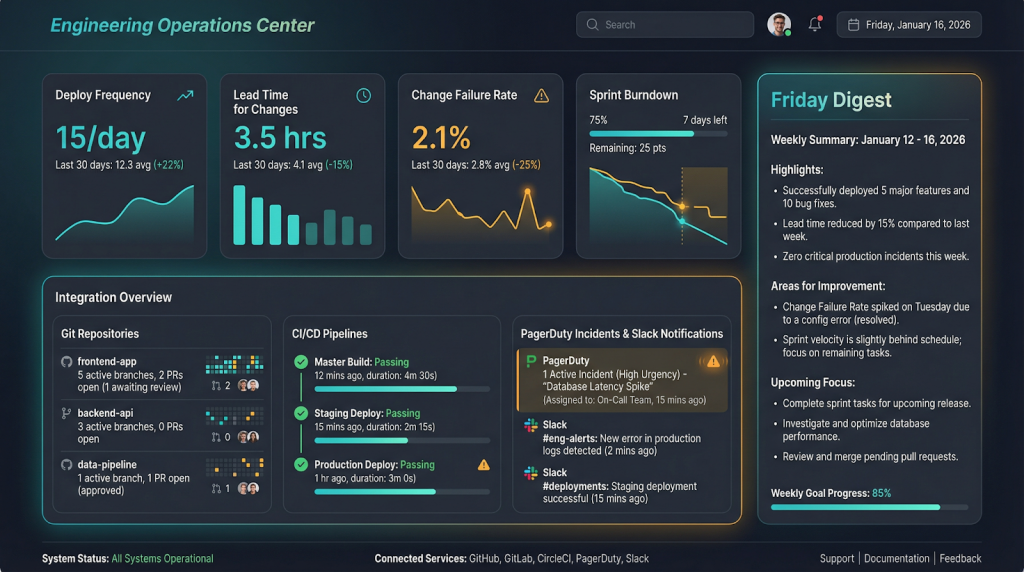
Scattered telemetry slows remote squads. Connect GitHub, your CI runner, PagerDuty, and Slack, and TeamDynamics plots deploy frequency, lead time, and change-failure rate next to sprint burndowns with no manual tags. Managers get a Friday digest that flags churn or stuck reviews, while engineers receive gentle Slack nudges that keep code moving without feeling monitored. Company data shows most teams reach a live dashboard in under 60 minutes after approving integrations. That speed matters: 60 percent of DevSecOps professionals juggle five or more development tools, a sprawl GitLab’s 2026 survey links to lost productivity (GitLab, November 10, 2026). TeamDynamics gives your team one clear cockpit instead of a patchwork of gauges.
LinearB: free DORA dashboards with workflow boosts
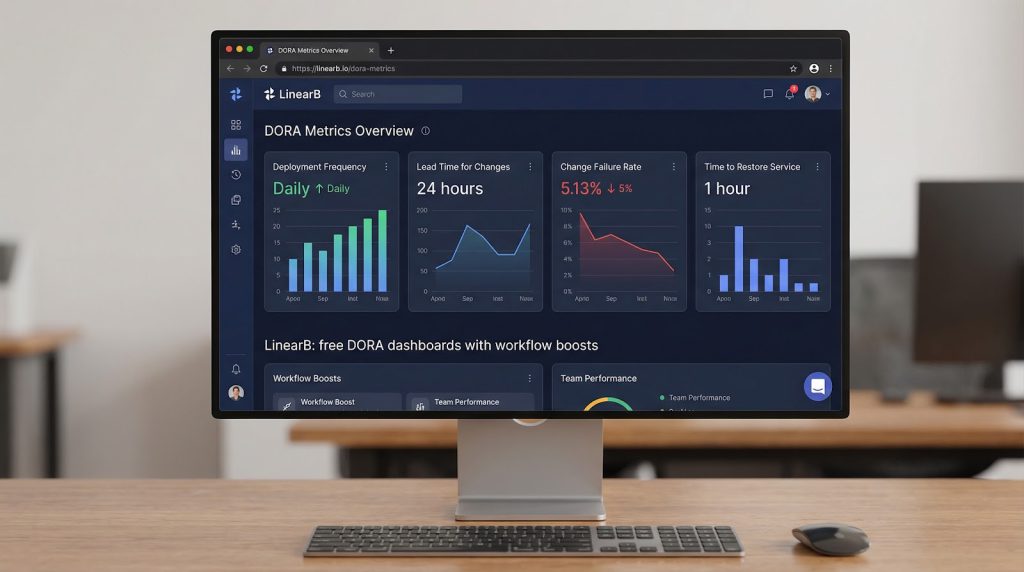
LinearB drew attention at the 2023 DevOps Enterprise Summit when it made its DORA dashboards free for every team, from five-person startups to Fortune 500 companies (LinearB). Once you connect Git, Jira, and PagerDuty, the platform charts deploy frequency, lead time, change-failure rate, and MTTR, then nudges reviewers on idle pull requests and auto-sorts risky backlog items.
The automation pays off. Agriculture-tech firm Syngenta cut cycle time by 81 percent within six months of adopting LinearB (LinearB), while Super.com saw a 200 percent jump in cycle-time accuracy after adding the tool to coaching sessions (LinearB). For remote squads, those data-driven nudges replace spreadsheet wrangling with real-time course corrections, all inside one SaaS login.
Jellyfish: tying engineering effort to business impact
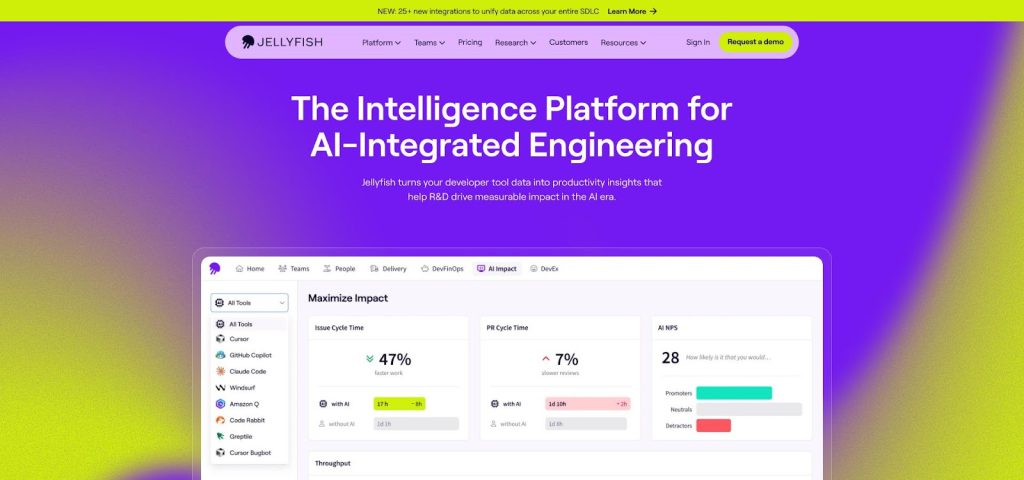
Jellyfish helps you answer the board’s favorite question: “What are we getting for our engineering budget?” Its allocation engine turns commits, tickets, and roadmap items into a dollar snapshot of where your capacity goes: new features, tech debt, or unplanned compliance tasks.
That money lens delivers results. Buildium shifted 24 percent more effort to roadmap work and doubled sprint velocity within three months of adopting Jellyfish (Jellyfish). Blue Yonder saw a 15 percent lift in delivery predictability, matched that gain in efficiency, and now saves 20 hours a month on capitalization reports (Jellyfish).
You still get core DORA metrics, but the real advantage is mapping deploy frequency or MTTR to revenue milestones and customer-satisfaction targets. With that view, engineering moves from cost center to measurable value creator, giving your CFO numbers to drop straight into quarterly slides or visualize clearly using modern AI presentation software.
Swarmia: real-time balance between speed and sustainability
Swarmia pulls data from GitHub, Jira, and Slack, then pairs core DORA metrics with an Investment Balance dial that shows how work splits among features, maintenance, and refactors. The numbers refresh on every commit, so your remote stand-up can spot a spike in bug-fix work today instead of next quarter.
Results prove the value. Learnship cut cycle time by 20–25 percent and trimmed maintenance effort by 25 percent after adopting Swarmia in 2024 (Swarmia). Gorgias trimmed cycle time by 40 percent in two months and sees more than 80 percent daily adoption among engineers (Swarmia).
New funding will speed up the roadmap: Swarmia raised €10 million ($11 million) in June 2026 from DIG Ventures and Karma Ventures to expand its AI-powered recommendations (TechCrunch, June 18, 2026). If you want elite speed without burnout, Swarmia gives your squad an evidence-based early-warning system instead of yet another dashboard.
Pluralsight Flow (formerly Code Climate Velocity): spotlight on review speed and code quality
Flow zeroes in on the moment code slows down—the pull-request queue. Connect GitHub or GitLab and your CI runner, and Flow measures PR lifespan by the hour, alerts reviewers in Slack when a hand-off stalls, and pairs DORA roll-ups with defect density so you can see whether speed helps or harms quality.
Results back the claims. Across all users, Flow reports a 35 percent average cut in cycle time and a 14-hour drop in time to merge after rollout (Pluralsight, 2026). AppDirect trimmed time to resolve PRs by 64 percent and reduced unreviewed PRs by 10 percent within one quarter (Pluralsight, 2026). For remote teams, the Work Patterns dashboard flags after-hours coding spikes, an early warning of burnout, so you can rebalance workload before attrition rises.
If you need to squeeze idle time out of reviews while keeping a close eye on defects, Flow gives your team and your auditors metrics they can trust.
Waydev: instant Git lens for outcome-oriented managers
Waydev is built for leaders who need yesterday’s commits to answer today’s stand-up questions. Connect Git, your CI server, and the platform auto-calculates DORA metrics, PR cycle time, and rework percentage with no manual tags.
Dashboards arrive pre-filtered by team, repo, or sprint, and a Daily Digest turns the numbers into a two-minute briefing.
Speed and security are proven. Customers report up to a 20 percent cut in cycle time and time to market after adopting Waydev’s delivery insights (Waydev, 2026). Tata Health onboarded in under 60 minutes, citing Waydev’s rapid data pull as the deciding factor (Waydev, 2026). The service is SOC 3 certified and stores only .git metadata—never your source code (Waydev, 2026).
When you want a low-friction, numbers-first view of how your team is really doing, Waydev delivers it with your morning coffee, not a spreadsheet marathon.
Workflow-centric DORA trackers and automation
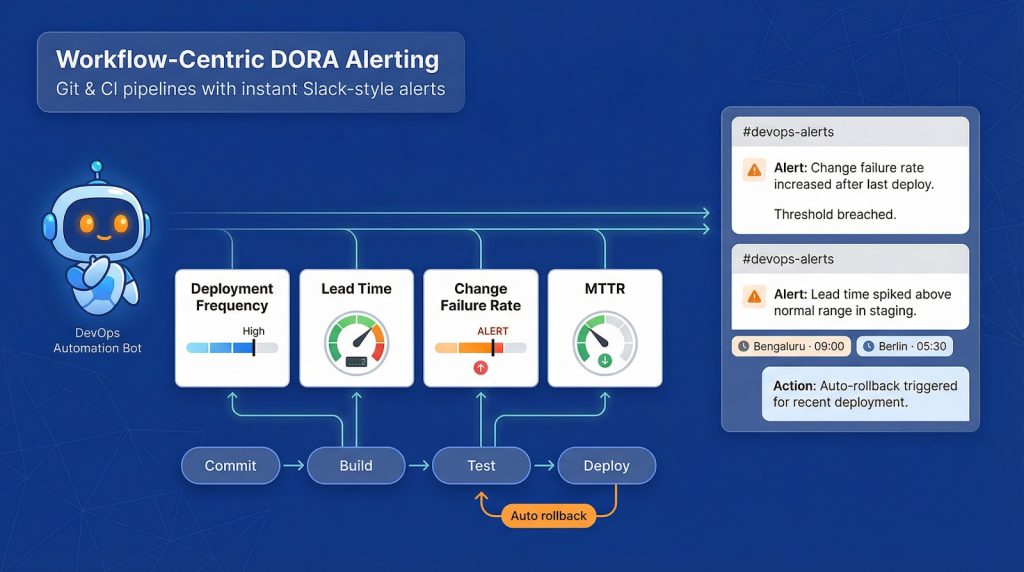
Some teams don’t need a full command center. You might just want a bot that watches the four DORA metrics and calls out the moment something drifts. Workflow-centric trackers fill that gap. By plugging directly into Git and CI/CD pipelines, they stream deploy data in real time, trigger Slack or Teams alerts when thresholds break, and can even roll back risky releases automatically. Gartner’s 2024 DevOps Survey reports that groups using automated DORA alerting resolve incidents 42 percent faster than those relying on manual dashboards, making these lightweight tools a quick win for remote squads that follow the sun.
Haystack: instant alerts that keep pipelines flowing
Haystack focuses on one job: sounding the alarm the moment a DORA metric drifts. Connect GitHub, GitLab, or Bitbucket, and Haystack starts streaming commits and deploying data. If lead time crosses your threshold or change-failure rate rises after a late-night merge, Slack fires an alert before customers ever feel it.
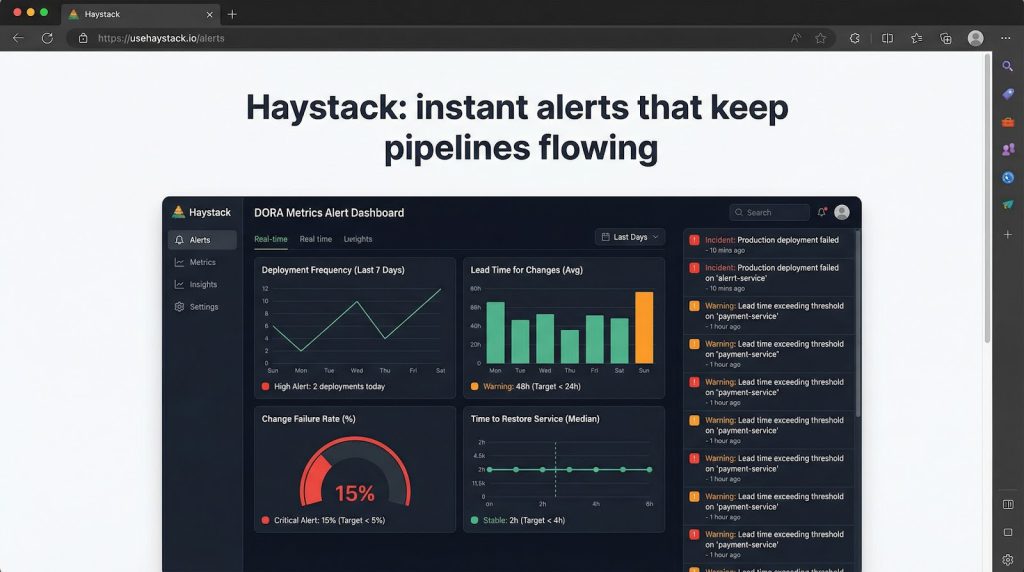
The speed shows up in the numbers. Oncology-software vendor Project Ronin cut cycle time from 30 days to 3 days and lifted delivery predictability to 98 percent within six months of adopting Haystack (Haystack, 2026). Box’s engineering team dropped cycle time from 40 days to 3 days after moving to the alert-driven workflow (Haystack, 2024).
Remote squads appreciate the same immediacy. An alert that appears in Bengaluru at 9 am is waiting for Berlin when their day begins, keeping follow-the-sun hand-offs smooth. Setup takes minutes; Haystack’s help site says most teams reach live dashboards in under 15 minutes with no custom tags or data scientists.
If you want a lightweight smoke detector for delivery risk, Haystack gives you numbers you can trust without the weight of a full platform.
Sleuth: deployments mapped to outcomes, minus the noise
Sleuth treats each deploy, not each commit, as the source of truth. Hook it into your CI/CD pipeline or webhooks, and the platform logs every production push, feature-flag toggle, and rollback, then pairs those events with lead time, change-failure rate, and MTTR.
That precision shows up in the numbers. Puma’s e-commerce team lifted deployment frequency by 400 percent within one year of adopting Sleuth and its flag-aware tracking (Sleuth, 2026). The onboarding guide says most teams import 30 days of historical deploy data and see live DORA metrics within five minutes.
Remote squads save time on post-mortems, too. Incident heat maps point directly to the deploy and flag that introduced risk. Because Sleuth focuses on deployment telemetry only, it works with any Git host and CD tool, from Argo to LaunchDarkly, giving you and your SREs a verifiable ledger of what changed for audits and on-call shifts alike.
Developer-experience and well-being analytics
Velocity without sustainability is a short-lived victory. Microsoft’s 2024 Work Trend Index found that 46 percent of knowledge workers already feel burned out by the pace, volume, and constant context switching of modern work (Microsoft, 2024). For remote engineering squads, where time-zone hand-offs and chat overload stretch the day, tracking focus time, context switching, and after-hours coding matters as much as monitoring deploy frequency. The next tool shows how to surface those human signals before they turn into attrition or outages.
Uplevel: surfacing focus time and burnout signals
Uplevel addresses the human side of DevOps by turning Slack traffic, calendar events, and Jira churn into metrics for focus time, context switching, and after-hours work. Engineering managers receive weekly heat maps that reveal when meetings cut into makers’ hours or late-night pings spike in one region. Because DORA roll-ups sit beside those people metrics, you can see exactly when extra effort starts to hurt productivity.
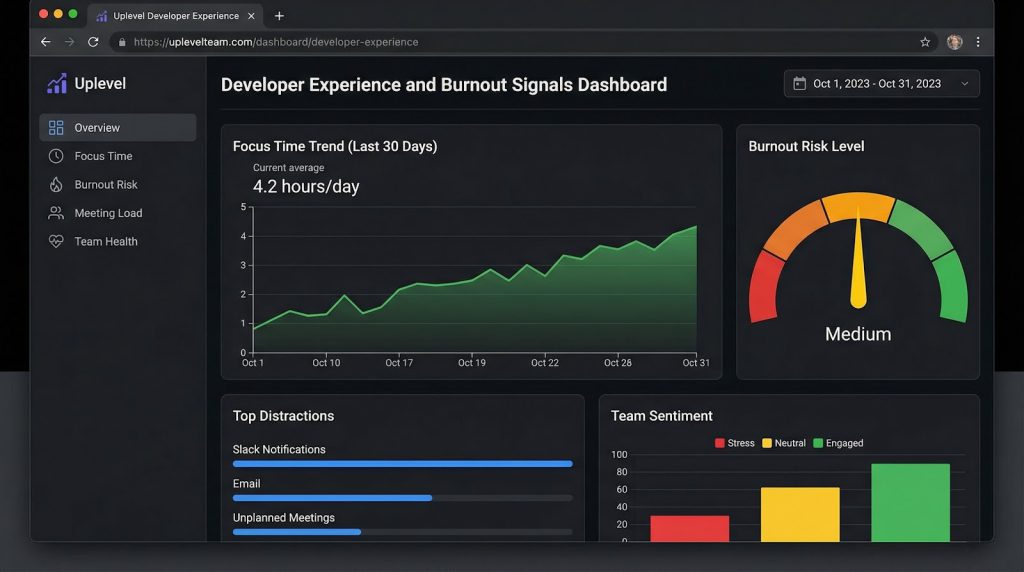
Customer results highlight the impact:
- Qualtrics lifted employee-engagement scores from 73 percent to 83 percent in one quarter after using Uplevel to grow deep-work time and reduce “always-on” alerts (Uplevel, 2026).
- Avalara trimmed merge-request cycle time from four weeks to three hours, a 30× improvement, while deployment frequency jumped 1,100 percent without raising bug rates (Uplevel, 2026).
The setup is light. Authorize Slack and Jira, connect Git, and Uplevel backfills 30 days of history in minutes, not days. When faster lead times start to erode well-being, Uplevel surfaces the warning so you can act before burnout becomes turnover.
Flexible and self-hosted value-stream platforms
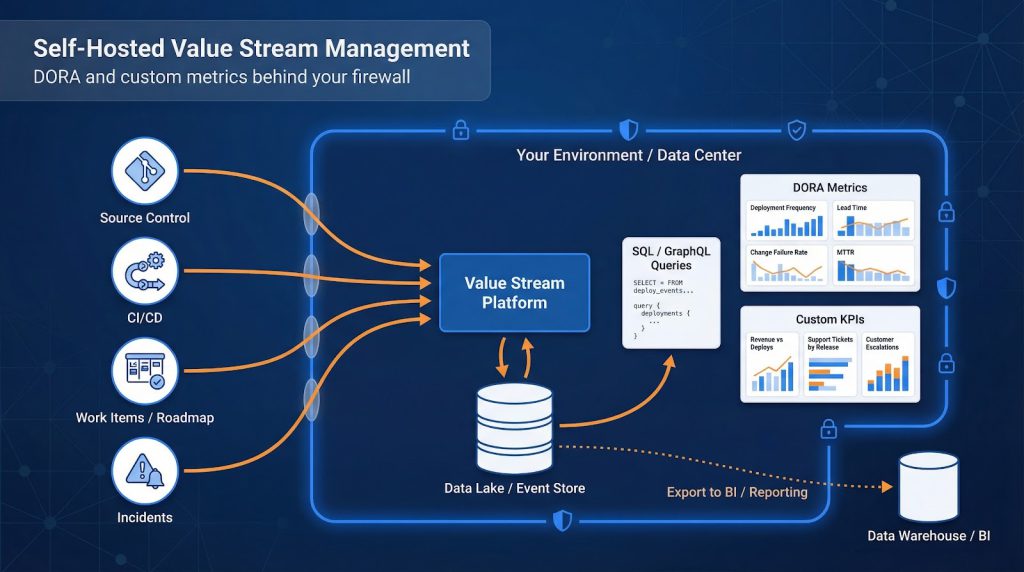
Some organizations cannot send engineering telemetry to a vendor cloud because of regulations, customer contracts, or risk posture. They still need the end-to-end visibility that SaaS suites provide. Self-hosted value-stream platforms fit that gap. Install them behind your firewall, pipe Git, CI/CD, incident, and product-roadmap events into your own data lake, and define any metric—DORA or custom—in SQL or GraphQL. Forrester’s 2022 Value Stream Management Landscape reports that 95 percent of VSM vendors now offer a self-hostable option, citing data sovereignty as the top driver for enterprise deals (Forrester, 2022). If your security lead questions cloud dashboards, the next platform puts you in full control without losing features or compliance.
Faros: build-it-your-way engineering operations
Faros meets the “keep it on-prem” mandate with an open-source core you can run behind the firewall while matching SaaS suites for breadth. Connect Git, CI/CD, incident, and roadmap tools, and Faros streams the data into a Neo4j graph you control. Out of the box you get DORA dashboards plus lenses such as Rework Rate and Code Hotspots. Need something custom? Drop a SQL or GraphQL snippet in the UI, and the chart appears next to the defaults.
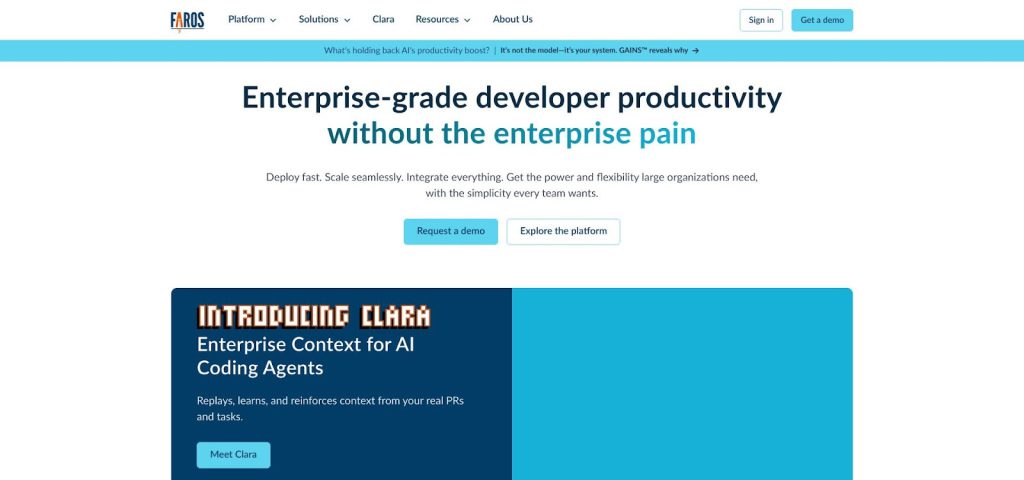
Adoption is growing fast. Since launching Faros Community Edition in April 2026, the project has earned 7,000 GitHub stars and 1,200 self-hosted deployments (Faros, 2026). Fortune 500 users export the event graph to Snowflake or BigQuery, then join engineering signals with revenue and support data for end-to-end value-stream analytics. If data sovereignty and custom KPIs top your checklist, Faros gives you full control without compromising breadth.
Conclusion
Remote DevOps teams succeed or stall based on what they can see. When delivery health, quality signals, and team sustainability live in disconnected tools, leaders react late and engineers feel the drag. The tools in this guide show there is no single “best” dashboard—only the right fit for your team’s maturity, constraints, and goals.
Full-stack engineering-intelligence suites shine when you need a shared source of truth across Git, CI/CD, incidents, and planning. Lightweight DORA trackers win when speed, alerts, and minimal overhead matter most. Developer-experience analytics add a human lens that protects long-term velocity, while self-hosted value-stream platforms give regulated organizations full control without giving up insight.
A practical way forward is to start small: pick one platform that makes the four DORA metrics visible within days, not months. Use those signals to guide conversations, not punish individuals. As your remote team grows, layer in deeper analytics only where decisions demand them. When metrics are trusted, visible, and tied to outcomes, distributed DevOps teams can move with the same confidence as if everyone were standing in front of the same wall-mounted dashboard.
Frequently Asked Questions (FAQ)
What are the most important DevOps metrics for remote teams?
Most organizations start with the DORA metrics: deployment frequency, lead time for changes, change-failure rate, and mean time to recovery (MTTR). For remote teams, it’s also useful to track review turnaround time, work-in-progress limits, and indicators of collaboration health (for example, excessive after-hours work or meeting overload).
Are DevOps performance tools used to monitor individual engineers?
The tools in this guide are designed for team-level performance management, not individual surveillance. Best practice is to use metrics to spot system bottlenecks and workflow issues, then improve processes together. Tools that emphasize trends and aggregates are far more effective—and healthier—than those focused on individual ranking.
Do we need a full engineering-intelligence suite, or is a DORA tracker enough?
It depends on your needs.
- If you want quick visibility and alerts around delivery health, a workflow-centric DORA tracker may be enough.
- If leadership needs to connect engineering output to business impact, or if multiple teams share complex dependencies, a full-stack suite is usually worth the investment.
How hard is it to implement these tools for a remote team?
Most modern platforms are designed for fast setup. Many teams see usable dashboards within 15–60 minutes after connecting Git, CI/CD, and ticketing tools. The real work is not technical—it’s agreeing on which metrics matter and how they’ll be used in retrospectives and planning.
Can these tools replace regular stand-ups and retrospectives?
No—and they shouldn’t. Performance management tools support conversations; they don’t replace them. The strongest teams use dashboards to ground discussions in data, then rely on stand-ups and retrospectives to interpret the numbers and decide what to change next.
Are open-source or self-hosted options viable alternatives to SaaS?
Yes. For teams with strict security or data-sovereignty requirements, self-hosted value-stream platforms can deliver the same breadth of insight as SaaS tools. The trade-off is usually more setup and maintenance in exchange for full control and customization.
How do we avoid metric gaming or burnout?
Keep metrics transparent, contextual, and team-owned. Combine delivery metrics with sustainability signals like focus time or after-hours work, and review them regularly in a blameless way. When teams understand that metrics exist to improve flow—not to assign blame—gaming decreases and trust grows.
I’m Rajesh Kumar, a DevOps, SRE, DevSecOps, Cloud, and Platform Engineering expert passionate about sharing practical knowledge, real-world experiences, and industry best practices. I have worked at Cotocus and regularly write about technology, travel, investing, health, product reviews, and digital marketing through my various platforms.
I publish technical articles at DevOps School, travel stories at Holiday Landmark, stock market insights at Stocks Mantra, health and fitness guidance at My Medic Plus, product reviews at TrueReviewNow, and SEO and digital marketing strategies at Wizbrand.
Find Trusted Cardiac Hospitals
Compare heart hospitals by city and services — all in one place.
Explore Hospitals