1. What this screen is showing
How to install?
$ dotnet tool install –global dotnet-counters
Your command:
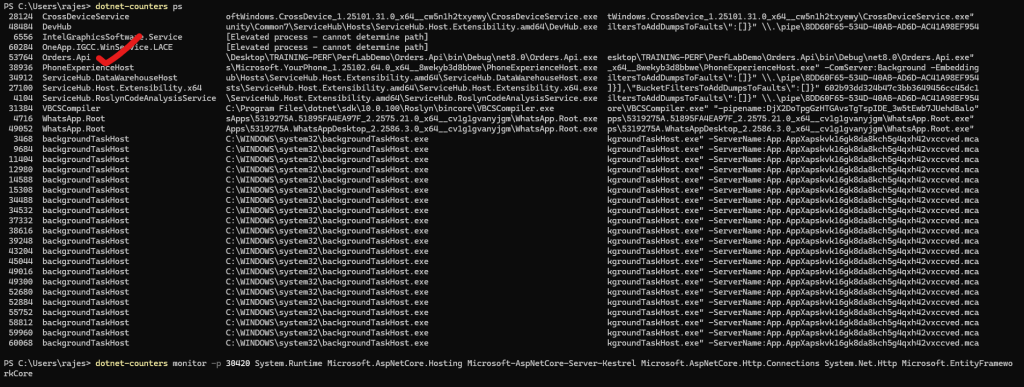
$ dotnet-counters ps
$ dotnet-counters monitor -p 30420 System.Runtime Microsoft.AspNetCore.Hosting Microsoft-AspNetCore-Server-Kestrel Microsoft.AspNetCore.Http.Connections System.Net.Http Microsoft.EntityFrameworkCore
And the section you pasted is only the [System.Runtime] provider – i.e. core .NET runtime health.
This is the “vitals panel” of the CLR:
- CPU
- GC
- JIT
- ThreadPool
- Memory usage
And right now the numbers show a mostly idle app (no meaningful load).
2. Key metrics in your output (with meaning)
I’ll go through the most important ones and tell you how to explain them.
🔹 CPU Usage (%)
CPU Usage (%)  0.198
Code language: CSS (css)- How to say it: “Overall process CPU usage as seen by the .NET runtime.”
- Here it’s ~0.2%, so the app is basically idle.
🔹 Allocation Rate (B / 1 sec)
Allocation Rate (B / 1 sec) 16,400
- New managed memory allocated per second on the managed heap.
- Under real load, this can be MB/sec or GB/sec.
- For your naive vs optimized demo:
- Naive code → higher allocation rate (lots of short-lived objects)
- Optimized → lower allocation rate → less GC pressure.
🔹 GC Heap Size (MB) & GC Committed Bytes (MB)
GC Heap Size (MB)         3.192
GC Committed Bytes (MB)  10.277
Code language: CSS (css)- GC Heap Size: How much managed heap is currently in use.
- GC Committed Bytes: Total memory the GC has reserved/committed from the OS.
- Story for slides:
- “If Heap Size keeps growing and never comes down, we may have a memory leak or a workload that allocates a lot and doesn’t release.”
🔹 % Time in GC & Time paused by GC
% Time in GC since last GC (%)   0
Time paused by GC (ms / 1 sec)   0
% Time in GC: Fraction of time the runtime is doing GC work.Time paused by GC: Time the app is stopped for GC per second.- Under heavy allocation:
- High
% Time in GCand non-zeroTime paused by GC→ GC is impacting throughput / latency. - In your demo you could show:
“Naive bulk insert → higher % time in GC; optimized version → less.”
- High
🔹 Gen 0 / Gen 1 / Gen 2 counts & sizes
Gen 0 GC Count (Count / 1 sec)  0
Gen 0 Size (B)                  646,848

Gen 1 GC Count (Count / 1 sec)  0
Gen 1 Size (B)                  832

Gen 2 GC Count (Count / 1 sec)  0
Gen 2 Size (B)                  1,989,064
- Gen 0/1/2 Sizes: How much of each generation is currently occupied.
- Gen 0/1/2 GC Count (/sec): How often GC runs for each generation.
- How to narrate:
- “Gen 0 is for short-lived objects; Gen 2 is long-lived (e.g., caches, static data).”
- “Too many Gen 2 collections → expensive, can cause noticeable pauses.”
For an idle app, counts/sec = 0 is normal.
🔹 LOH Size & POH Size
LOH Size (B)        98,384
POH Size (B)       130,680
- LOH (Large Object Heap): Objects ≥ 85 KB (arrays, big strings, etc.).
- POH (Pinned Object Heap): Objects that can’t be moved (e.g. for interop).
- Slide point:
- “Large or pinned heaps that keep growing can cause memory fragmentation and larger GCs.”
🔹 Monitor Lock Contention Count
Monitor Lock Contention Count (Count / 1 sec) 0
- Number of times threads block waiting for
lock/Monitor.Enter. - Under contention, this will be non-zero.
- Good line for your talk: “If this counter spikes during load, we’re likely hitting lock contention – too many threads fighting for the same lock.”
🔹 ThreadPool metrics
ThreadPool Completed Work Item Count (Count / 1 sec)  0
ThreadPool Queue Length                              0
ThreadPool Thread Count                              0
- Completed Work Item Count: How many ThreadPool tasks are completing per second.
- Queue Length: Pending work items waiting for threads.
- Thread Count: Number of ThreadPool threads (this being 0 is likely a momentary state; usually you’ll see > 1 when load comes in).
What to say:
- “If Queue Length grows but Thread Count doesn’t grow fast enough, we have ThreadPool starvation.”
- “Under load, we expect some reasonable thread count and completed work items/sec.”
🔹 JIT metrics
IL Bytes Jitted (B)           528,863
Number of Methods Jitted      6,639
Time spent in JIT (ms / 1 sec) 0
Code language: JavaScript (javascript)- IL Bytes Jitted / Methods Jitted: Total IL compiled to machine code.
- Time spent in JIT: JIT cost per second.
- Early after startup:
- These numbers grow quickly.
- Later they flatten once code is “warmed up.”
- Slide story: “JIT happens mostly at startup and first-time execution; after that the cost should be negligible.”
🔹 Working Set (MB)
Working Set (MB)  106.906
Code language: JavaScript (javascript)- Total physical memory in use by the process (managed + native).
- Use it to show overall footprint.
- In your story:
- “Naive version might cause working set to grow more due to excessive allocations or caching.”
🔹 Assemblies Loaded & Active Timers
Number of Assemblies Loaded  137
Number of Active Timers      2
Code language: JavaScript (javascript)- Assemblies loaded → footprint of the app’s codebase.
- Active Timers → number of timers scheduled (e.g., background jobs, periodic tasks).
Not usually your first troubleshooting metric, but nice context.
3. How to use this in training/demo
For your perf engineering session, you can say:
“This is our baseline view with
System.Runtime:
- CPU is ~0% → our app is idle.
- Allocation rate is tiny, GC time is 0 → no GC pressure.
- Heap is ~3 MB, working set ~107 MB → small footprint.
Now let’s send load and watch:
- CPU Usage
- Allocation Rate
- % Time in GC / Time paused by GC
- ThreadPool Queue Length
- Working Set (MB)
and compare naive vs optimized implementation.”
If you’d like, next I can:
- Take these exact counters and write 2–3 slide pages:
- “Top 8 System.Runtime counters every .NET engineer should know”
- Each with 1-line explanation + “How to interpret when it’s high”.
CREATE LOAD
$ curl -k -X POST “https://localhost:5001/api/orders/bulk-optimized?count=100000”
Nice, now we’re seeing real activity – this is exactly the kind of snapshot you want to show in your perf session as “app under load”.
Let’s decode it in a focused way and then I’ll give you slide-ready talking points.
1️⃣ What changed vs earlier (idle) snapshot?
Earlier:
- Allocation Rate: ~16 KB/sec
- GC Heap Size: ~3 MB
- Working Set: ~107 MB
- CPU: ~0.2%
Now:
Allocation Rate (B / 1 sec)   50,067,464   ≈ 50 MB/sec
CPU Usage (%)                  5.159
GC Heap Size (MB)            239.699
GC Committed Bytes (MB)      361.464
Working Set (MB)             491.52
Gen 2 Size (B)               1.1923e+08 ≈ 113.7 MB
LOH Size (B)                 27,713,016 ≈ 26.4 MB
ThreadPool Thread Count      6
ThreadPool Completed Work
    Item Count (/sec)        609
Monitor Lock Contention
    Count (/sec)             2
Time spent in JIT (ms/sec)   12.602
Story in one line:
👉 “Under load, the app is allocating ~50 MB/sec, heap has grown to ~240 MB, working set to ~490 MB, some JIT work still happening, and the ThreadPool is actively processing ~600 work items/sec with a little lock contention.”
2️⃣ Key counters & how to interpret them
🚀 Allocation Rate – 50 MB/sec
- This is very high compared to your idle state.
- Great demo point:
“Our workload allocates ~50 MB of managed objects every second. If this stays high, GC will eventually need to work harder, potentially increasing GC pauses.”
For naive implementation you’d expect:
- Higher allocation rate
- More frequent GCs later
- Possible % Time in GC and Time paused by GC increasing when pressure rises
🧠 Heap & Memory Footprint
GC Heap Size (MB)       ≈ 240 MB
GC Committed Bytes (MB) ≈ 361 MB
Working Set (MB)        ≈ 492 MB
Gen 2 Size              ≈ 114 MB
LOH Size                ≈ 26 MB
Code language: JavaScript (javascript)
Points:
- “The managed heap alone is about 240 MB now.”
- “The GC has reserved ~360 MB from the OS to manage this heap.”
- “Total working set (managed + native) is about 490 MB.”
- “A big part of memory is in Gen 2 (long-lived objects, ~114 MB) and some in LOH (~26 MB, large arrays/buffers).”
“If GC Heap Size and Gen 2 Size keep growing and rarely shrink, we may be trending toward a memory leak or a very heavy long-lived cache.”
⏱ GC & Pauses
% Time in GC (%)         0
Time paused by GC (ms/s) 0
Gen 0 / Gen 1 / Gen 2
    GC Count (/sec)      0
- Despite high allocations, at the moment of this sample:
- No collections in that 1-second window.
- No GC pause time in that exact second.
Important nuance:
“This is a 1-second snapshot. We’re seeing high allocations, but GC didn’t happen in this particular second. Over time, we’d expect this to eventually trigger GCs; when that happens,
% Time in GCandTime paused by GCwill start to show non-zero values.”
🧵 ThreadPool & Concurrency
ThreadPool Thread Count                 6
ThreadPool Completed Work Item (/sec)  609
ThreadPool Queue Length                 0
Monitor Lock Contention Count (/sec)    2
How to narrate:
- “We have 6 ThreadPool threads currently handling ~600 work items per second.”
- “Queue length is 0 → threads are keeping up with the load.”
- “Lock contention count is 2/sec → a small but non-zero sign that some threads occasionally wait on locks.”
In a problematic scenario you’d see:
- High Queue Length + low Thread Count → ThreadPool starvation.
- High Lock Contention Count/sec → contention on
lock/critical sections.
🧩 JIT Activity
IL Bytes Jitted (B)      ≈ 1.2 MB
Number of Methods Jitted 15,635
Time spent in JIT (ms/s) 12.602
Code language: JavaScript (javascript)- Still some JIT happening (12.6 ms/sec).
- You can say:
“As the workload exercises more code paths, we see JIT still compiling methods. Once warm,
Time spent in JITshould drop close to 0.”
Useful to highlight “warm-up” behavior vs “steady state”.
3️⃣ summary
Title: Example – System.Runtime under Load
- CPU Usage: ~5% – app is doing real work but not CPU-bound yet.
- Allocation Rate: ~50 MB/sec – high allocation pressure; GC will need to work harder as load continues.
- GC Heap Size: ~240 MB; GC Committed: ~360 MB – significant managed memory footprint.
- Gen 2 & LOH: ~114 MB (Gen 2), ~26 MB (LOH) – many long-lived / large objects.
- GC Time / Pauses: 0% and 0 ms in this snapshot – no GC happening in this particular second.
- ThreadPool: 6 threads, ~600 work items/sec, queue length 0 – threads are keeping up with request load.
- Lock Contention: 2/sec – minor contention, not yet alarming.
- Working Set: ~490 MB – overall process memory usage.
“This snapshot shows our app under load: high allocation rate, large heap and working set, active ThreadPool, and some lock contention. Right now GC isn’t pausing us, but if we keep allocating at ~50 MB/sec, we will eventually see more GC activity and potential pauses.”
I’m a DevOps/SRE/DevSecOps/Cloud Expert passionate about sharing knowledge and experiences. I have worked at Cotocus. I share tech blog at DevOps School, travel stories at Holiday Landmark, stock market tips at Stocks Mantra, health and fitness guidance at My Medic Plus, product reviews at TrueReviewNow , and SEO strategies at Wizbrand.
Do you want to learn Quantum Computing?
Please find my social handles as below;
Rajesh Kumar Personal Website
Rajesh Kumar at YOUTUBE
Rajesh Kumar at INSTAGRAM
Rajesh Kumar at X
Rajesh Kumar at FACEBOOK
Rajesh Kumar at LINKEDIN
Rajesh Kumar at WIZBRAND
Find Trusted Cardiac Hospitals
Compare heart hospitals by city and services — all in one place.
Explore Hospitals
This lab is a strong hands‑on complement to learning real‑time diagnostics in .NET, showing how to use dotnet‑counters in a live scenario rather than just theory. It guides you through attaching the tool to a running process, selecting meaningful counters (e.g., CPU usage, GC heap size, thread‑pool metrics) and interpreting what the numbers mean in a real application stress context. For anyone training interns or building up team capability in observability and performance engineering, these kinds of demo labs bridge the gap between “tool installed” and “I understand what the results mean and what I should do next”.