This is the official-level guide that includes:
✔ What
✔ Why
✔ When
✔ Architecture
✔ Key Terminology
✔ How to Use (Step-by-Step)
✔ CPU / Disk / Network / Memory deep explanation
✔ Use Cases
✔ Troubleshooting
✔ Advantages & Limitations
✔ Best Practices
RESOURCE MONITOR (resmon.exe): The Complete One-Stop Tutorial
1. Introduction
What is Resource Monitor?
Resource Monitor (resmon.exe) is a built-in Windows tool that provides real-time, process-level monitoring of CPU, Memory, Disk, and Network activity.
It shows exactly:
- Which process is consuming CPU
- Which process & file is causing disk I/O
- Which process is sending/receiving network traffic
- How much memory each process uses
- Which handles or modules a process has open
- Detailed activity of threads, file operations, TCP connections, and hard faults
Resource Monitor is essentially Task Manager on steroids and is the most accurate real-time troubleshooting tool for Windows systems.
2. Why Resource Monitor Exists (Purpose)
Resource Monitor solves a major problem:
You need to know EXACTLY which process is misbehaving — in real time.
Task Manager only shows:
- High-level CPU, memory, disk
- No per-file, per-port, or per-thread details
PerfMon shows:
- Historical counters
- Deep OS and application metrics
- Not real-time per-process insight
Resource Monitor fills the gap:
✔ Real-time monitoring
✔ Process-specific visibility
✔ Per-file and per-port tracking
✔ Instant bottleneck identification
It’s ideal for investigation, troubleshooting, and quick diagnosis.
3. When to Use Resource Monitor
Use Resource Monitor when:
✔ “The server is slow”
Identify which process is eating CPU, disk, or memory.
✔ API or website is slow
Check if disk I/O or network traffic is blocking the app.
✔ Memory leak suspected
Check Working Set, Private KB, Hard Faults/sec.
✔ High Disk IO / SSD thrashing
Find the exact file/process responsible.
✔ Malware or unknown process suspected
Check network connections & TCP endpoints.
✔ SQL, IIS, .NET apps consuming too many resources
Find real-time usage and culprit modules/files.
✔ During load testing
Use it alongside PerfMon to see real-time behavior.
Resource Monitor = immediate root-cause analysis.
4. Key Terminology
Process
A running program (dotnet.exe, chrome.exe, sqlservr.exe)
Thread
Execution unit inside a process. Responsible for CPU usage.
Handles
File handles, registry entries, network sockets used by a process.
Working Set
Actual RAM used by a process.
Private Bytes
Memory allocated exclusively to that process.
Hard Faults/sec
When data must be retrieved from disk instead of RAM
High = memory pressure or insufficient RAM.
Disk Queue Length
How many disk operations are waiting.
High = disk bottleneck.
TCP Connections
Real-time list of open network connections.
5. Resource Monitor Architecture
Windows Kernel + Processes
       ↓
Resource Monitor Engine
       ↓
Real-Time Data Providers
       ↓
CPU / Disk / Network / Memory Tabs
       ↓
Graphs + Process-Level Tables
Data comes from:
- Windows Kernel
- NTFS
- TCP/IP stack
- Memory Manager
- I/O Manager
- Process Manager
Resource Monitor acts as a viewer, not a metrics collector.
6. How to Open Resource Monitor
Method 1 – Run command
Win + R → resmon
Method 2 – From Task Manager
Ctrl + Shift + Esc → Performance tab → Open Resource Monitor
Method 3 – Start Menu Search
Search “Resource Monitor”
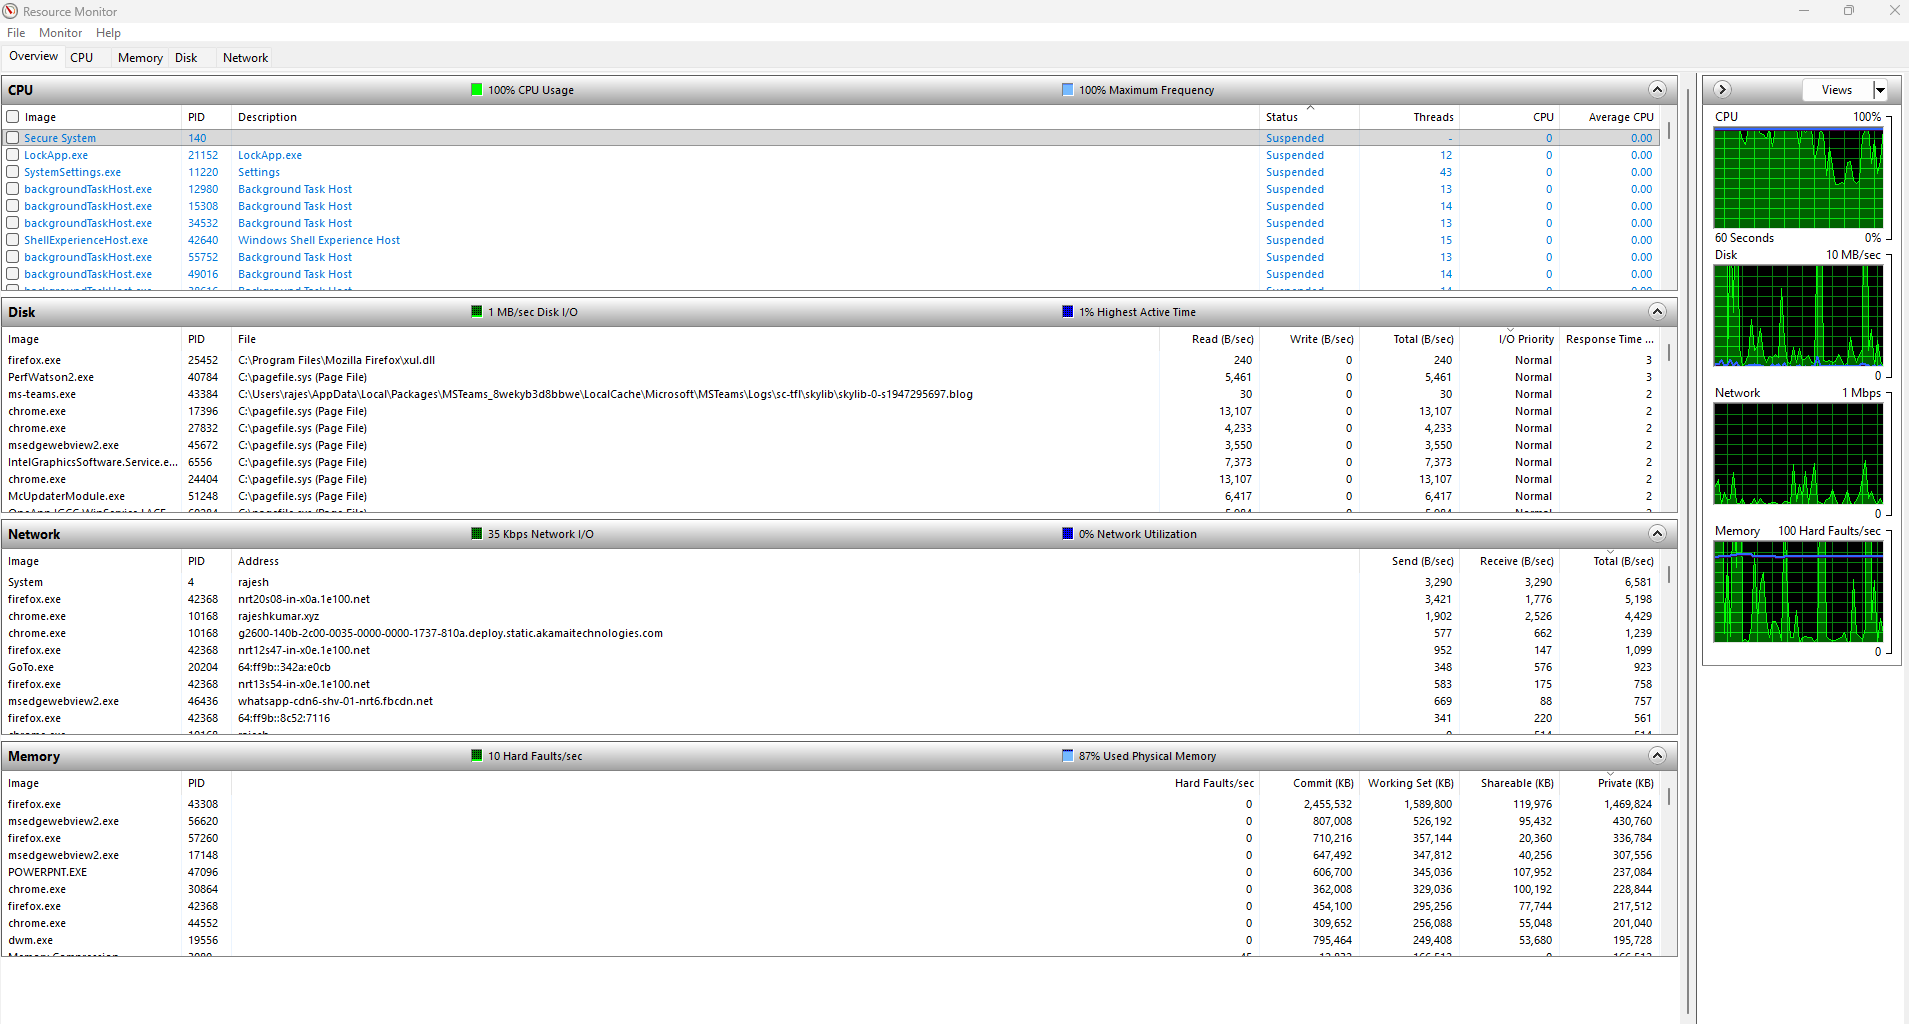
7. Understanding the Resource Monitor UI
Resource Monitor has four main tabs, each with deep insight:
- CPU
- Memory
- Disk
- Network
Plus Overview tab that shows summaries of all four.
8. Resource Monitor Sections Explained (Deep Dive)
8.1 CPU Tab
Shows:
- Per-process CPU %
- Threads per process
- Services running inside svchost
- CPU usage timeline
- Threads activity
- Handles and modules
Use Cases:
✔ Find CPU-hogging process
✔ Detect multithreading bottlenecks
✔ See which DLLs/modules a process loaded
✔ Kill or suspend problematic processes
8.2 Memory Tab
Shows:
- Private KB
- Working Set
- Shareable memory
- Commit size
- Hard Faults/sec
- Total physical memory usage
- Kernel memory
- Standby list
Use Cases:
✔ Detect memory leaks
✔ Identify app causing paging
✔ Analyze hard faults (memory pressure)
✔ Compare Working Set vs Private Bytes
✔ See memory fragmentation
8.3 Disk Tab
Shows:
- Real-time disk activity per process
- Files being read/written (full path)
- IO Read Bytes/sec
- IO Write Bytes/sec
- Disk Queue Length
- Response time
Use Cases:
✔ Identify disk hogging processes
✔ Troubleshoot slow API due to disk contention
✔ Detect heavy logging or temp-file writes
✔ Identify malware using disk
8.4 Network Tab
Shows:
- Per-process network usage
- Remote addresses / ports being accessed
- TCP connections
- Listening ports
- Network I/O
- Packet loss or connection failures
Use Cases:
✔ Troubleshoot slow API calls
✔ Detect suspicious outbound connections
✔ Check bandwidth consumption
✔ Identify port conflicts
✔ Check which app is using which port
9. How to Use Resource Monitor (Step-by-Step)
STEP 1 — Open Resource Monitor
Win + R → resmon
STEP 2 — Start with Overview Tab
This shows immediate CPU, Disk, Memory, and Network activity.
Look for:
- High CPU (red spike)
- High Disk I/O
- High hard faults
- High network usage
STEP 3 — Investigate CPU
Go to CPU tab:
- Sort by Average CPU
- Right-click a process → Analyze Wait Chain
- Expand Services for svchost.exe
- Expand Threads to see hot threads
Use when CPU is suddenly high.
STEP 4 — Investigate Memory
Go to Memory tab:
- Check Hard Faults/sec
- Sort by Commit or Working Set
- Identify memory hogs
- Detect leaks by watching Commit climb continuously
- Look for low Free memory and high Standby
STEP 5 — Investigate Disk
Go to Disk tab:
- Check Disk Queue Length
- Sort by Total (B/sec)
- Expand a process to see the EXACT file being accessed
- Identify slow response time (ms)
Great for:
- Slow websites
- Slow SQL Server
- High I/O .NET apps
STEP 6 — Investigate Network
Go to Network tab:
- Sort by Total (B/sec)
- Check open TCP connections
- Check listening ports
- Identify outbound connections
Great for:
- Debugging API failures
- Detect malware
- See which process uses a specific port
10. Real-World Use Cases
Use Case 1: High CPU
Symptoms:
- Server slow
- CPU near 100%
Solution:
- Open CPU tab
- Sort by Average CPU
- Identify top offender
- Expand Threads → find responsible module
Use Case 2: Memory Leak
Symptoms:
- RAM gradually fills
- Slow response
Solution:
- Open Memory
- Watch Private KB and Working Set
- Check if Commit grows nonstop
Use Case 3: Slow Disk / SSD Thrashing
Symptoms:
- High disk usage
- Website/API slows down
Solution:
- Go to Disk
- View Disk Queue Length
- See which file is causing reads/writes
Use Case 4: API Network Slowness
Symptoms:
- Slow API calls
- High latency
Solution:
- Check Network tab
- Look at connections to backend servers
- Check packet loss or high outbound connections
Use Case 5: Identify Malware or Suspicious Process
Symptoms:
- Unknown traffic
- Unusual CPU I/O
Solution:
- Check Network
- Detect unknown IPs
- Kill/inspect malicious process
Use Case 6: IIS/Self-Hosted .NET App Slow
Symptoms:
- High latency
- Slow response
Solution:
- CPU → thread issues
- Memory → GC pressure
- Disk → log writing or DB I/O
- Network → backend API slowness
11. Advantages of Resource Monitor
✔ Real-time and high-accuracy
✔ Lightweight and built-in
✔ Shows per-process metrics (unique)
✔ Shows per-file and per-port activity
✔ Great for immediate troubleshooting
✔ Can pause, filter, and drill down
✔ Zero installation required
12. Limitations
❌ Not built for long-term monitoring
(PerfMon/DCS is better)
❌ No historical/log export
(Use PerfMon or ETW)
❌ No advanced analytics
(Use dotnet-trace, PerfView, Grafana, New Relic)
❌ Not ideal for cloud distributed systems
13. Best Practices
✔ Use ResMon + PerfMon together
Real-time + deep counters = complete picture.
✔ Always sort CPU/Memory/Disk columns
Easiest way to find culprits.
✔ Watch Hard Faults/sec
High = memory pressure or low RAM.
✔ Expand processes to see files & connections
Gives 100% visibility.
✔ Use “Analyze Wait Chain” for deadlocks
Unique and extremely powerful.
✔ Use Filter by Process
Instantly isolate everything a process touches.
14. Summary
Resource Monitor is one of the most powerful real-time diagnostic tools in Windows.
It provides:
- Per-process CPU
- Per-process Disk + File I/O
- Per-process Memory
- Per-process Network + TCP ports
- Hard faults, queue lengths, response time
No Windows performance troubleshooting is complete without Resource Monitor + PerfMon working together.
🎁 Optional Add-ons (Say YES and I will generate)
✔ A 10-Slide Resource Monitor Training Deck
✔ PerfMon vs ResMon Comparison Slides
✔ A one-page ResMon cheat sheet PDF
✔ Infographic diagrams for CPU/Disk/Memory/Network
Just tell me “Create Slides”, “Give me cheat sheet”, or “Create diagrams”.
I’m a DevOps/SRE/DevSecOps/Cloud Expert passionate about sharing knowledge and experiences. I have worked at Cotocus. I share tech blog at DevOps School, travel stories at Holiday Landmark, stock market tips at Stocks Mantra, health and fitness guidance at My Medic Plus, product reviews at TrueReviewNow , and SEO strategies at Wizbrand.
Do you want to learn Quantum Computing?
Please find my social handles as below;
Rajesh Kumar Personal Website
Rajesh Kumar at YOUTUBE
Rajesh Kumar at INSTAGRAM
Rajesh Kumar at X
Rajesh Kumar at FACEBOOK
Rajesh Kumar at LINKEDIN
Rajesh Kumar at WIZBRAND
Find Trusted Cardiac Hospitals
Compare heart hospitals by city and services — all in one place.
Explore Hospitals
This tutorial offers a comprehensive walkthrough of the Resource Monitor tool and is especially helpful for IT professionals, DevOps engineers and system administrators who need to dig deeper than Task Manager. By covering its five tabs—Overview, CPU, Memory, Disk and Network—the article clearly explains how to filter by process, identify high‑usage threads, spot disk queue build‑ups or network connections, and interpret memory hard faults. The step‑by‑step lab style makes it practical, while the guidance on real‑world troubleshooting (such as isolating a particular process and watching its resource footprint across all subsystems) lends it strong applicability for performance diagnostics and capacity planning.