Below is the definitive, step-by-step list of PerfMon counters you must add for .NET / ASP.NET Core / API / Microservices performance optimization.
This is the same checklist used in enterprise performance engineering, load testing, and production diagnostics.
I will give you:
✔ Exact counters
✔ In step-by-step order
✔ Why each counter matters
✔ Which ones are optional vs mandatory
✔ What values are considered “bad”
This is your final PerfMon Counter Checklist for .NET performance.
STEP-BY-STEP: Add These PerfMon Counters for .NET Application Performance Optimization
🔵 STEP 1 — Add Essential CPU Counters (Mandatory)
✔ Processor
- % Processor Time — _Total
- % Privileged Time — _Total
- % Interrupt Time
- Processor Queue Length (from System)
✔ Process (for your app)
Select instance:
➡ dotnet, w3wp, or yourapp.exe
Add:
- % Processor Time
- Thread Count
- Handle Count
- Private Bytes
- Working Set
- IO Data Bytes/sec
- IO Read Bytes/sec
- IO Write Bytes/sec
Why CPU counters matter
- Detect CPU saturation (>80%)
- Find thread pool starvation
- Detect infinite loops, heavy JSON serialization, LINQ misuse
- Detect high kernel (privileged) usage → drivers, encryption, networking
🟣 STEP 2 — Add Memory Counters (Mandatory)
✔ Memory
- Available MBytes
- % Committed Bytes in Use
- Pages/sec
- Page Reads/sec
- Cache Faults/sec
- Committed Bytes
✔ Process (your app)
- Private Bytes (memory leak indicator)
- Virtual Bytes
- Working Set
- Page Faults/sec
Why Memory counters matter
- Identify memory leaks
- Detect high paging → application slowdown
- Understand GC pressure
- Identify large object allocations
🟢 STEP 3 — Add Disk I/O Counters (Mandatory)
✔ PhysicalDisk
(_Total)
- Avg. Disk Queue Length
- Avg. Disk sec/Read
- Avg. Disk sec/Write
- Disk Reads/sec
- Disk Writes/sec
- Current Disk Queue Length
✔ LogicalDisk
- % Free Space
- Free Megabytes
Why disk counters matter
- Identify disk bottlenecks
- Troubleshoot long API latency caused by slow file or database I/O.
- Detect heavy logging or temp file writes
🟡 STEP 4 — Add Network Counters (Mandatory for API/Web App)
✔ Network Interface
- Bytes Total/sec
- Bytes Received/sec
- Bytes Sent/sec
- Output Queue Length
- Packets/sec
- Packets Outbound Errors
- Packets Received Errors
✔ TCPv4
- Connections Established
- Connection Failures
- Segments Retransmitted/sec
Why network counters matter
- Understand throughput
- Detect API congestion
- Detect retransmissions (network instability)
🔴 STEP 5 — Add .NET CLR Counters (CRITICAL for .NET Performance)
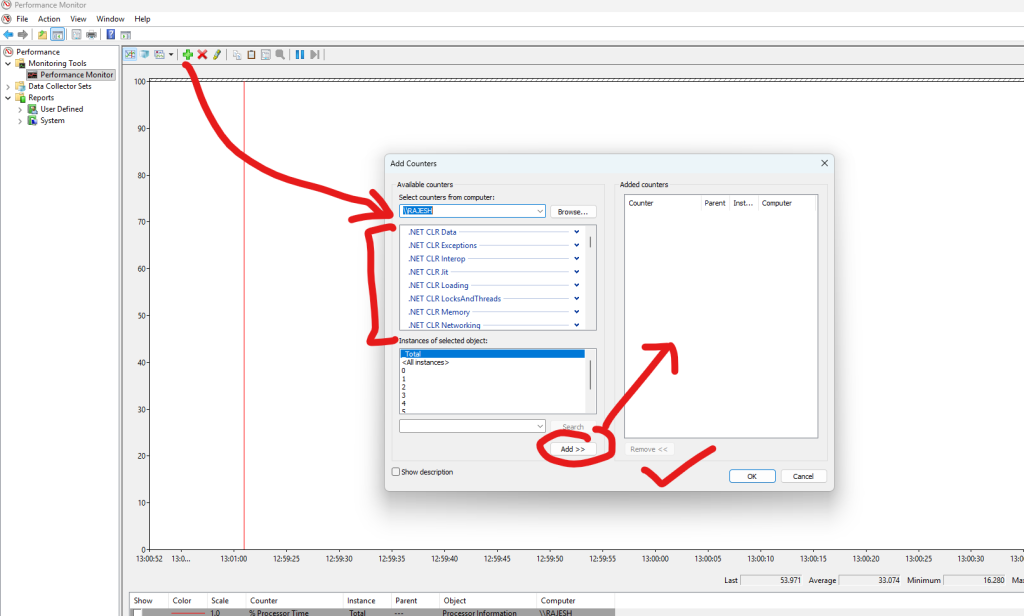
➡ In PerfMon UI, expand:
“.NET CLR Memory”
“.NET CLR Exceptions”
“.NET CLR Jit”
“.NET CLR LocksAndThreads”
“.NET CLR Networking”
Select your instance:
dotnet, w3wp, or your application name.
🍀 .NET CLR MEMORY (Very Important)
✔ Add these:
- % Time in GC
- Gen 0 Collections
- Gen 1 Collections
- Gen 2 Collections 🔥
- Large Object Heap Size 🔥
- # Bytes in all Heaps
- Promoted Memory/sec
- Finalization Survivors
- GC Handles
Interpretation:
| Counter | Meaning |
|---|---|
| % Time in GC > 15% | Too much GC blocking = slow app |
| Frequent Gen 2 GC | Memory pressure / large objects |
| High LOH size | Large object allocations causing fragmentation |
| High Promoted MB/sec | Short-lived objects living too long |
🍀 .NET CLR EXCEPTIONS
Add:
- # of Exceptions Thrown/sec
This indicates:
- Poor coding practices
- Bad error handling
- Hidden exceptions killing performance
If > 100/sec consistently → WRONG code.
🍀 .NET CLR LOCKS & THREADS
Add:
- # of current logical Threads
- # of current physical Threads
- Contention Rate/sec
- Queue Length
Indicates:
- Thread pool starvation
- Async deadlocks
- High locking contention
🍀 .NET CLR JIT
Add:
- % Time in JIT
- IL Bytes Jitted/sec
JIT issues appear on:
- Cold starts
- Large reflection / dynamic LINQ usage
🟤 STEP 6 — Add ASP.NET / IIS Counters (If Web App or API)
✔ ASP.NET Applications
(Select your app pool)
Add:
- Requests/Sec
- Requests Queued
- Requests Rejected
- Request Execution Time
- Pipeline Instance Count
✔ ASP.NET
- Application Restarts
- Worker Process Restarts
✔ Web Service
(For old .NET Framework)
- Total Method Requests/sec
✔ WinHTTP Proxy/Service
If using HttpClient extensively.
🔵 STEP 7 — Add Kestrel & Hosting Counters (.NET Core Self-hosted)
If running on Kestrel (non-IIS):
✔ ASP.NET Core Hosting
- Current Requests
- Requests/sec
- Request Queue Length
✔ Kestrel
(Available in dotnet counters, but PerfMon may expose via EventSource)
- Connection queue length
- Active connections
- TLS handshake duration
🟣 STEP 8 — Add SQL Server Counters (If Your App Uses DB)
Category: SQLServer:SQL Statistics
- Batch Requests/sec
- Compilations/sec
- Re-Compilations/sec
Category: SQLServer:Buffer Manager
- Buffer cache hit ratio
- Page life expectancy (PLE)
Category: SQLServer:General Statistics
- User Connections
- Processes blocked
Category: SQLServer:Wait Statistics
- Lock waits/sec
- Latch waits/sec
These help detect:
- Query bottlenecks
- High CPU SQL queries
- Plan cache issues
- Memory pressure
🎯 FINAL: Complete List (Copy-Paste Checklist)
Here is the single list you can paste into training material:
✔ CPU
- Processor → % Processor Time (_Total)
- Processor → % Privileged Time
- Processor → % Interrupt Time
- System → Processor Queue Length
- Process(dotnet/w3wp/app.exe) → % Processor Time
- Thread Count
- Handle Count
✔ Memory
- Memory → Available MBytes
- Memory → % Committed Bytes
- Memory → Pages/sec
- Process → Private Bytes
- Process → Page Faults/sec
- Process → Working Set
✔ Disk
- Avg. Disk Queue Length
- Avg. Disk sec/Read
- Avg. Disk sec/Write
- Disk Reads/sec
- Disk Writes/sec
✔ Network
- Bytes Total/sec
- TCP Retransmissions/sec
- Connections Established
- Packets Errors
✔ .NET CLR Memory
- % Time in GC
- Gen 0/1/2 Collections
- Promoted MB/sec
- Bytes in All Heaps
- LOH Size
✔ .NET CLR Exceptions
- Exceptions/sec
✔ .NET CLR LocksAndThreads
- Contention Rate/sec
- Logical Threads
- Physical Threads
✔ ASP.NET / Hosting
- Requests/sec
- Current Requests
- Request Queue Length
- Request Execution Time
✔ SQL Server
- Batch Requests/sec
- SQL Compilations/sec
- SQL Re-compilations/sec
- Buffer Cache Hit Ratio
- Page Life Expectancy
I’m Rajesh Kumar, a DevOps, SRE, DevSecOps, Cloud, and Platform Engineering expert passionate about sharing practical knowledge, real-world experiences, and industry best practices. I have worked at Cotocus and regularly write about technology, travel, investing, health, product reviews, and digital marketing through my various platforms.
I publish technical articles at DevOps School, travel stories at Holiday Landmark, stock market insights at Stocks Mantra, health and fitness guidance at My Medic Plus, product reviews at TrueReviewNow, and SEO and digital marketing strategies at Wizbrand.
Find Trusted Cardiac Hospitals
Compare heart hospitals by city and services — all in one place.
Explore Hospitals
This lab‑style tutorial provides a practical, step‑by‑step walkthrough of using Windows’ built‑in Performance Monitor (PerfMon) tool. It goes beyond the basics by showing how to select meaningful performance counters (CPU usage, process working set, GC cycles, SQL Server batch requests) and compare real‑world scenarios—such as non‑optimized versus optimized code paths. For DevOps engineers or SREs teaching interns, this piece is especially valuable because it bridges the gap between “what can I monitor” and “how do I interpret the data to find a bottleneck or design flaw”. With the kind of hands‑on examples provided, it’s an excellent resource for boosting your ability to gather actionable metrics and then use them for performance tuning or capacity‑planning exercises.