Modern enterprise applications development demands treating performance as a core requirement from day one. A fast, efficient app leads to higher user satisfaction and directly impacts revenue – every 100ms of added latency costs Amazon about 1% of sales. Performance also underpins customer retention and SLA compliance. The mature .NET ecosystem (ASP.NET Core, C#, and an optimized runtime) provides an ideal foundation for building enterprise-grade systems to meet these high demands.

What “High Performance” Means in the Enterprise
Figure: Visualization of how system latency (response time) rises as throughput (requests per second) increases beyond a threshold. High performance means maintaining low latency even as load increases, until reaching system limits.
Teams track p95/p99 latency (95th/99th percentile response times), peak throughput (requests per second), startup time, memory footprint, error rates, and cost per transaction. These technical metrics tie directly to business outcomes. A snappy e-commerce checkout or real-time dashboard that loads within milliseconds boosts conversions and user satisfaction – over 53% of mobile visitors will abandon a site that takes more than 3 seconds to load. By agreeing on performance budgets for these metrics upfront and aligning them with SLOs, stakeholders ensure “fast enough” is clearly defined.
Architecture Choices That Move the Needle
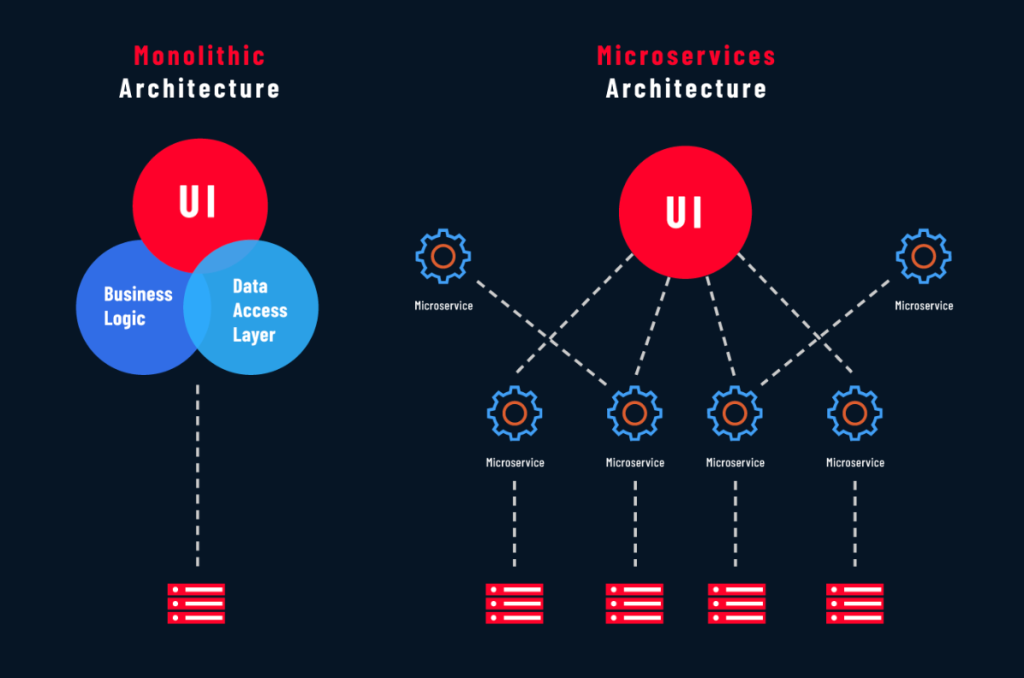
- Right-sized modularity: A well-structured monolith can avoid the overhead of too many microservices, preventing accidental complexity that hurts performance.
- Async everything: Prefer asynchronous I/O for handling requests. In ASP.NET Core, use async controllers and handlers so threads aren’t blocked waiting on I/O.
- Data access discipline: Interact with databases efficiently. Eliminate “N+1” query patterns by fetching related data in one round-trip or using projections. Keep transactions short and scoped; long-held database locks can stall other requests.
- Smart caching: Introduce caching layers to serve frequent reads quickly. Use in-memory caches (like MemoryCache or Redis) for hot data that doesn’t change often, and implement a distributed cache for scaling out across servers.
- Efficient service communication: When building APIs or internal service calls, choose lightweight protocols. Use slim JSON payloads or gRPC for binary serialization to reduce payload size.
- Lean middleware & startup: Configure your .NET application for speed. Only include necessary middleware in the ASP.NET request pipeline; each extra middleware or filter adds latency (“one more middleware” syndrome to avoid).
Tooling: Measure, Don’t Guess
Building a high-performance app requires continuous measurement. You can’t improve what you don’t monitor; profiling and observability tools are key:
- Profiling & tracing: Use profilers to capture CPU hotspots, memory allocations, and garbage collection pauses during test runs. Instrument critical end-to-end user flows with tracing (e.g., using Application Insights or OpenTelemetry) to see how requests propagate through services and where the time is spent.
- Benchmarking: Create microbenchmarks for performance-critical functions using libraries like BenchmarkDotNet. This helps in optimizing algorithms or code sections in isolation.
- Load testing: Don’t deploy untested performance. Integrate load tests into your CI/CD pipeline using tools like JMeter, k6, or Azure Load Testing. Conduct ramp-up tests (gradually increasing load), soak tests (sustained load over time), and spike tests (sudden traffic bursts) before each release.
- Observability: Emit structured logs with correlation IDs so you can trace a single user’s request across services. Collect metrics on key indicators, e.g., average and p95 response times per endpoint, RPS, CPU/memory usage, garbage collection frequency, and queue lengths. Use distributed tracing to pinpoint slow calls in a microservices chain.
Data & Persistence Patterns for Throughput
The way your application interacts with databases and external systems can make or break performance:
- Choose read/write models consciously – Adopt CQRS (Command Query Responsibility Segregation) only when it delivers measurable benefits. Serve most reads from fast, pre-computed views or caches, and handle writes via streamlined, efficient pipelines.
- Keep transactions tight – Minimize transaction duration to avoid blocking. Favor idempotent, retry-safe operations over holding locks for long periods. Break large processes into smaller atomic steps to reduce contention and improve responsiveness.
- Optimize queries and connections – Use connection pooling (built into NET), prepared or compiled queries for frequently executed SQL, and apply pagination or streaming to process large datasets incrementally. This keeps memory use predictable and response times stable.
- Employ write-behind or outbox patterns – Decouple heavy or slow tasks from the hot path. Let users see fast responses while background jobs handle cache updates, event publishing, or integrations. The outbox pattern ensures reliable event delivery without slowing main transactions.
- Re-platform legacy .NET systems – Migrate older applications to modern .NET 6/7 for runtime efficiency gains (e.g., reduced P95 latency, faster JIT, improved memory management). Engage dedicated .NET developers with migration expertise to ensure smooth transitions and maximize performance improvements.
- Security & compliance by design – Implement policy-as-code, adopt zero-trust architecture, and enforce encryption across data in transit and at rest.
Cloud-Native Efficiency
Running enterprise apps in the cloud offers flexibility, but you must actively manage resources for performance and cost:
- Right-size & autoscale – Match compute resources to actual demand using meaningful SLIs like latency or queue depth, avoiding costly over-provisioning and performance drops from underutilization.
- Reduce cold starts – Containerize .NET services for predictable startups and keep pre-warmed instances ready on critical paths to maintain responsiveness during scale-out events.
- Ensure data locality – Place cache, database, and application in the same region to minimize cross-zone latency, and use regional deployments for global coverage.
- Ongoing cost-performance tuning – Review metrics each sprint, remove idle “zombie” resources, and adjust scaling thresholds.
Team Model: Why a Dedicated .NET Pod Works
High performance isn’t just about code, it’s about people and process.
- Focused, cross-functional team: A dedicated .NET pod typically includes back-end developers, QA engineers, DevOps/cloud specialists, and an architect working in unison. This stable team structure reduces handoffs and context-switching.
- Shared performance mindset: An embedded team develops a culture of performance excellence. They can establish standards like performance-centric code reviews (catching inefficient logic early), automated performance tests for each feature, and a “definition of done” that requires hitting p95 latency targets in staging.
- Rapid iteration & governance: With a dedicated team, performance improvements don’t wait for a separate “phase”; they happen continuously. The same team that builds features also profiles them, tunes queries, and improves caching as they go. This reduces the risk of late-stage surprises.
Avoid These Performance Anti-Patterns
Even experienced teams can fall into traps that hurt performance. Beware of:
- Over-microservicing too early – Splitting a small app into many services introduces needless network overhead and complexity.
- Synchronous fan-out chains – Cascading calls (service A waits on B, which waits on C…) amplify latency and failure risk.
- N+1 query patterns – e.g., querying inside a loop, causing dozens of small DB calls instead of one set-based call.
- Global locks – Using application-wide locks or mutexes that serialize requests.
- Unbounded in-memory caches – Caches that grow without limits can consume memory and even cause crashes.
- Debug/inefficient builds in production – Shipping a debug build or leaving on verbose logging/profiling in prod can degrade throughput dramatically.
- Excess middleware – Every extra layer (auth, logging, parsing) in the request pipeline adds latency.
7-Step Delivery Playbook for High-Performance Apps
To successfully design and deliver a high-performance enterprise application, follow a structured playbook:
- Audit key journeys & tech debt – Identify critical transactions and legacy bottlenecks.
- Define target architecture & plan – Set performance SLOs and integration roadmap.
- Secure budget & sponsorship – Gain leadership buy-in for tools, infra, and talent.
- Assemble talent – Use internal experts or hire dedicated .NET/performance teams.
- Pilot, measure, refine – Test a slice, compare to baseline, iterate.
- Scale iteratively – Roll out improvements with monitoring.
- Plan legacy retirement – Migrate and decommission old systems promptly.
Conclusion
In conclusion, exemplary system performance must be architected from the outset; it is not an afterthought that can be retrofitted during the final integration phase. By codifying performance service-level objectives and interleaving those objectives throughout every iterative development phase, organizations can architect products that not only meet user expectations but that measurably advance corporate value. Should project timelines contract or if particular technical competencies remain underdeveloped, engaging a focused, propriety-rooted .NET engineering unit will, given appropriate staffing and aligned technical focus, enable enterprises to achieve stipulated performance benchmarks without trade-offs.
Find Trusted Cardiac Hospitals
Compare heart hospitals by city and services — all in one place.
Explore Hospitals
This blog clearly explains why having a dedicated .NET development team is so important for building high-performance enterprise applications, not just basic business tools. I like how it connects key aspects such as scalable architecture, performance optimization, security, integration with legacy systems, and cloud-native development on platforms like Azure. The focus on long-term ownership, code quality, and ongoing maintenance shows that success is not only about launching an app, but also about making it reliable, future-ready, and easier to evolve with changing business needs. This is very useful for decision-makers who are comparing generic outsourcing with a focused, dedicated .NET team model.