A Complete Practical Guide for Memory Profiling Using Command Line
1. 🔍 What is dotMemory Console?
dotMemory Console (also called dotMemory Command-Line Profiler) is the free, headless version of JetBrains dotMemory that allows you to:
- Start .NET processes under memory profiling
- Attach to a running .NET process
- Automatically capture memory snapshots
- Trigger snapshots based on conditions (timer, memory growth, process start)
- Profile desktop apps, web apps, Windows services, IIS, WCF services
- Capture snapshots on servers, CI pipelines, or production-like environments
The console profiler produces snapshot (.dmw) files that can later be opened in the dotMemory GUI (paid), but everything up to taking snapshots is 100% free.
2. 🎯 Why Use dotMemory Console?
Because GUI profilers cannot run in many real scenarios.
dotMemory Console is perfect for:
✔ Profiling on servers
✔ Profiling CI/CD pipelines
✔ Profiling performance test environments
✔ Profiling apps running under service accounts
✔ Profiling IIS, Kestrel, Windows services
✔ Capturing snapshots automatically during load tests
✔ Capturing leaks in production-like staging
In short:
You use dotMemory Console when you need real-world profiling without installing heavy GUI tools.
3. 🧠 Why Memory Profiling Matters
Memory issues cause:
- High GC (Garbage Collection) → CPU spikes
- Slow response times
- Server crashes
- Out-of-memory exceptions
- Leaks (objects never collected)
- Long-lived objects blocking GC
- LOH (Large Object Heap) fragmentation
dotMemory Console helps you capture snapshots at the EXACT moment the issue happens, which is not possible with GUI tools.
4. 🧭 Where dotMemory Console Can Be Used
| Environment | Supported? |
|---|---|
| Windows Desktop | ✔ |
| Windows Server | ✔ |
| Linux (.NET Core) | ✔ |
| macOS (.NET Core) | ✔ |
| Docker | ✔ |
| Remote servers | ✔ |
| CI pipelines | ✔ |
| IIS / IIS Express | ✔ |
| Windows Services | ✔ |
| Console apps | ✔ |
| ASP.NET Core apps (Kestrel) | ✔ |
| Worker Services | ✔ |
5. 🏗 How dotMemory Console Works (Internals)
- You start profiling using commands like:
dotMemory startdotMemory get-snapshot
- The profiler injects into the CLR runtime.
- It records allocation stacks, object references, and GC behavior.
- When a snapshot is triggered:
- It dumps the entire managed heap.
- It saves it into a
.dmwworkspace file.
- You later open
.dmwin GUI (optional) to see:- Objects
- Leaks
- GC roots
- Retained memory
- Allocation hot paths
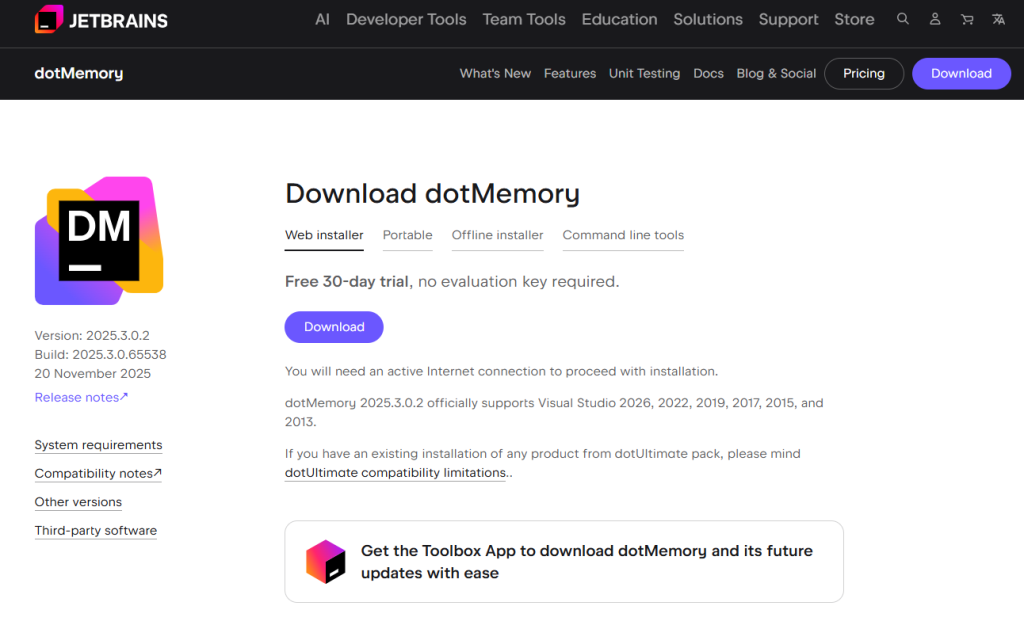
6. 📦 Installation (FREE)
Option 1: Global Install (Recommended)
dotnet tool install --global JetBrains.dotMemory.Console
Code language: CSS (css)
Check version:
dotmemory --version
Option 2: Local Install (Project-based CI)
dotnet new tool-manifest
dotnet tool install JetBrains.dotMemory.Console
Code language: CSS (css)
Option 3: Manual Download ZIP
Download from JetBrains (no account needed):
Search “JetBrains dotMemory Console download”
Extract to:
C:toolsdotmemory
Code language: CSS (css)
Run:
dotMemory.exe
Code language: CSS (css)
7. 🧰 Features of dotMemory Console (FREE)
✔ Attach to running processes
✔ Profile apps as they start
✔ Support for .NET Framework and .NET Core
✔ Automatic triggers
✔ No GUI needed
✔ Zero license cost
✔ Works on servers
✔ Snapshot packaging
✔ Works with IIS / Kiestrel / Windows Services
✔ Suitable for CI/CD
✔ Very low overhead
8. ⚡ Advantages
| Advantage | Explanation |
|---|---|
| ✔ Free | The full command-line profiler is FREE |
| ✔ Works on Servers | No need to install big GUI tools |
| ✔ Automation | Perfect for CI, load tests |
| ✔ No IDE dependency | Works with any environment |
| ✔ Supports all .NET apps | Desktop, web, service |
| ✔ Trigger-based profiling | Catch leaks automatically |
| ✔ Lightweight | Low overhead vs GUI |
9. ⚠ Limitations
| Limitation | Explanation |
|---|---|
| ❌ No visual interface | Must open snapshots in GUI (paid) |
| ❌ Cannot analyze snapshots in CLI | You only collect snapshots |
| ❌ No real-time object graph | GUI required to view |
| ❌ Not ideal for beginners | Requires understanding of profiling |
| ❌ Some runtime-specific features require GUI | E.g., graph-based navigation |
10. 🚀 How To Use dotMemory Console (Hands-On)
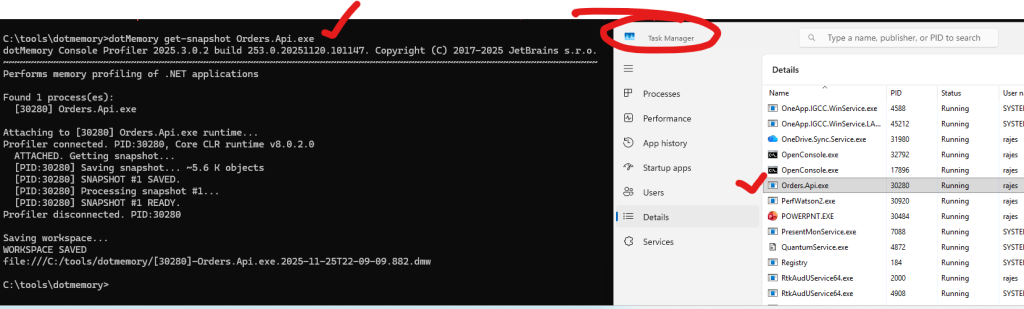
✔ 10.1 Take Snapshot of Running Process
By process name:
dotMemory get-snapshot MyApp.exe --save-to-dir=C:snaps
Code language: JavaScript (javascript)
By PID:
dotMemory get-snapshot 12564 --save-to-dir=C:snaps
Code language: JavaScript (javascript)
dotMemory chooses highest-memory instance if multiple processes exist.
✔ 10.2 Start App Under Profiling
dotMemory start --save-to-dir=C:snaps C:MyAppMyApp.exe
While app runs, you can manually trigger snapshot:
get-snapshot
Code language: JavaScript (javascript)
OR:
Ctrl + Enter
✔ 10.3 Start .NET Core App (Kestrel)
dotMemory start-net-core --save-to-dir=C:snaps -- MyApp.dll
✔ 10.4 Automatic Snapshots (Memory Increase Trigger)
Example: snapshot when memory increases by 40%
dotMemory start --trigger-mem-inc=40% --save-to-dir=C:snaps MyApp.exe
Perfect for:
✔ Memory leaks
✔ Load-test environments
✔ 10.5 Snapshots Every X Seconds
Every 30 seconds:
dotMemory start --trigger-timer=30s --save-to-dir=C:snaps MyApp.exe
✔ 10.6 At App Startup
dotMemory start --trigger-start --save-to-dir=C:snaps MyApp.exe
✔ 10.7 Profile IIS
Restart IIS under profiler:
dotMemory start-iis --save-to-dir=C:snaps
Attach:
dotMemory get-snapshot w3wp --save-to-dir=C:snaps
Code language: JavaScript (javascript)
✔ 10.8 Profile Windows Service
Start profiling:
dotMemory start-windows-service MyServiceName --save-to-dir=C:snaps
Take snapshot:
dotMemory get-snapshot MyServiceName --save-to-dir=C:snaps
Code language: JavaScript (javascript)
✔ 10.9 Profile Any Process Started Later
Use this for “capture everything that starts now”:
dotMemory profile-new-processes --save-to-dir=C:snaps
Code language: JavaScript (javascript)
11. 📊 What To See Inside Snapshots (When Opened in GUI)
Once you import .dmw file into dotMemory GUI, analyze:
- Overview Page
- Total objects
- Object count growth
- Retained memory
- Inspections
- Potential leaks
- Types that increase
- Long-lived objects
- Object Sets
- Group by type
- Size and count per type
- Retention Paths
- Why object is not collected
- GC roots
- Allocations
- Methods causing heavy memory traffic
- Compare Snapshots
- Before & after requests
- Leak tracking
12. 🧪 Real Use Cases
✔ 12.1 Detect Memory Leak in ASP.NET Core Under Load
Run:
dotMemory start --trigger-mem-inc=20% --save-to-dir=C:snaps -- dotnet MyApp.dll
Start JMeter / k6 load test
→ Snapshots collected → Analyze retained size differences.
✔ 12.2 Catch Leak in Windows Service
dotMemory get-snapshot MyServiceName --save-to-dir=C:snaps
Code language: JavaScript (javascript)
Restart service → reproduce issue → compare snapshots.
✔ 12.3 CI/CD Pipeline Memory Regression Check
In Jenkins/GitHub Actions:
dotMemory start-net-core --trigger-mem-inc=30% --save-to-dir=snaps -- MyApp.dll
Upload snaps to artifacts.
✔ 12.4 Taking a Snapshot Right Before Crash
Use trigger:
dotMemory start --trigger-mem-inc=80% --save-to-dir=C:snaps MyApp.exe
If memory shoots up (OOM), you get snapshot automatically.
✔ 12.5 Auto Snapshots Every X Minutes During Long-Running Tests
dotMemory start --trigger-timer=120s --save-to-dir=C:snaps MyApp.exe
13. 📁 Snapshot Storage and Recovery
Save snapshots:
--save-to-dir=C:snaps
If profiling crashed:
dotMemory recover C:snaps
Code language: CSS (css)
14. 🧾 Important Commands Cheat Sheet
| Purpose | Command |
|---|---|
| Start app under profiling | start |
| Start .NET Core app | start-net-core |
| Attach to process | get-snapshot <PID> |
| Auto snapshot on memory growth | --trigger-mem-inc=30% |
| Auto snapshot every X seconds | --trigger-timer=20s |
| Profile IIS | start-iis |
| Profile Windows Service | start-windows-service |
| Profile processes started later | profile-new-processes |
| Save snapshots | --save-to-dir=snaps |
| Recover workspace | recover |
15. 🎯 Best Practices for Performance Engineers
✔ Always save snapshots to a separate folder
✔ Take a baseline snapshot
✔ Take snapshot after load scenario
✔ Always compare snapshots
✔ Use memory-increase triggers for leaks
✔ Do not profile production unless necessary
✔ Automate snapshot collection in CI/CD
✔ Keep snapshots small by recording at correct moments
✔ Use GUI only for deep analysis
🎉 FINAL SUMMARY
dotMemory Console = Free, powerful, server-ready memory profiler for .NET
It gives you:
- Automatic snapshots
- Profiling of server apps
- Integration with performance testing
- 100% automation via command line
- Ability to capture leaks exactly when they happen
- No need for GUI installation
To analyze snapshots → you need dotMemory GUI (paid), but all profiling and snapshot generation is free.
I’m a DevOps/SRE/DevSecOps/Cloud Expert passionate about sharing knowledge and experiences. I have worked at Cotocus. I share tech blog at DevOps School, travel stories at Holiday Landmark, stock market tips at Stocks Mantra, health and fitness guidance at My Medic Plus, product reviews at TrueReviewNow , and SEO strategies at Wizbrand.
Do you want to learn Quantum Computing?
Please find my social handles as below;
Rajesh Kumar Personal Website
Rajesh Kumar at YOUTUBE
Rajesh Kumar at INSTAGRAM
Rajesh Kumar at X
Rajesh Kumar at FACEBOOK
Rajesh Kumar at LINKEDIN
Rajesh Kumar at WIZBRAND
Find Trusted Cardiac Hospitals
Compare heart hospitals by city and services — all in one place.
Explore Hospitals
This post gives a very practical and thorough guide to using dotMemory’s console‑based profiler for real‑world .NET applications. It clearly explains how the free command‑line version lets you start or attach to processes, trigger memory snapshots automatically or manually, and capture heap data without heavy GUI tools — perfect for server, CI/CD or production-like environments. The explanation of why memory profiling matters (GC pressure, memory leaks, Large Object Heap fragmentation, unexpected retention) makes a strong case for adopting dotMemory as part of your diagnostic workflow. Developers working on desktop apps, web services, or long‑running Windows/Linux services will find the step-by-step instructions and use‑cases especially helpful. Overall, this article makes memory‑profiling less intimidating and much more accessible.