This will be a fun little lab. Let’s make one self-contained Program.cs you can run from command line and flip between TLS 1.2 and TLS 1.3 without changing code.
We’ll also add a /metrics endpoint so you can see basic latency stats directly from the app.
1. One-page complete code (Program.cs)
Create a new minimal API:
dotnet new web -n TlsTlsDemoApi
cd TlsTlsDemoApi
Code language: JavaScript (javascript)
Now replace the entire contents of Program.cs with this:
2. How to run with TLS 1.2 vs TLS 1.3
🔹 Windows PowerShell
Run with TLS 1.2:
$env:TLS_VERSION = "12"
dotnet run
Code language: PHP (php)
You’ll see:
Using: TLS 1.2
Listening on: https://localhost:5001
Code language: JavaScript (javascript)
Run with TLS 1.3:
Stop the app, then:
$env:TLS_VERSION = "13"
dotnet run
Code language: PHP (php)
You’ll see:
Using: TLS 1.3
Listening on: https://localhost:5001
Code language: JavaScript (javascript)
3. How to “load test” it quickly
You can use Postman, or just use curl loops from command line.
🔹 Simple curl loop (Linux/macOS / Git Bash)
for i in {1..200}; do curl -k -s "https://localhost:5001/ping" > /dev/null; done
Code language: JavaScript (javascript)
🔹 Simple PowerShell loop (Windows)
1..200 | ForEach-Object {
curl -k -s "https://localhost:5001/ping" > $null
}
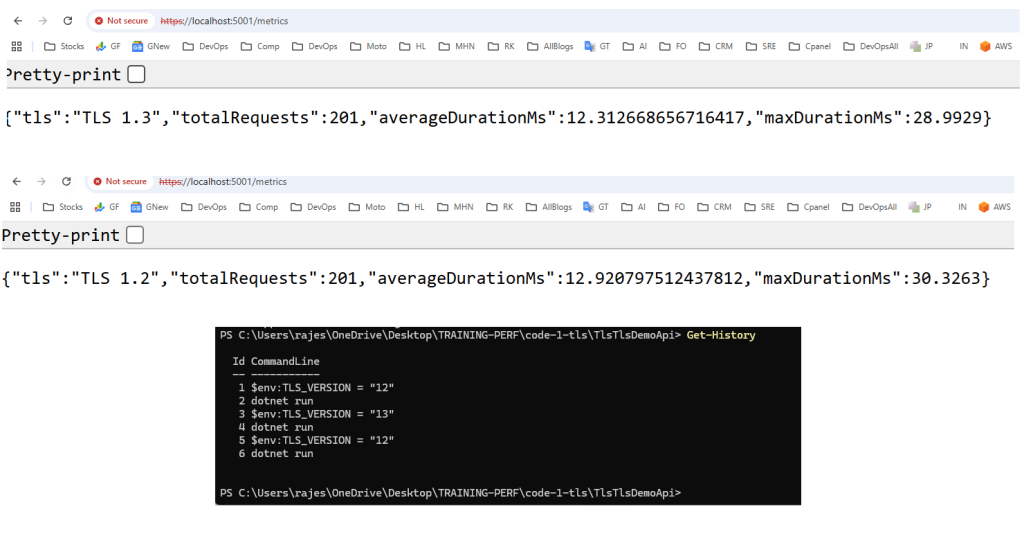
Code language: JavaScript (javascript)Then check metrics:
curl -k "https://localhost:5001/metrics"
Code language: JavaScript (javascript)
You’ll see something like:
{
  "tls": "TLS 1.2",
  "totalRequests": 200,
  "averageDurationMs": 6.3,
  "maxDurationMs": 15.2
}
Code language: JSON / JSON with Comments (json)
Run again with TLS 1.3 and compare:
averageDurationMsmaxDurationMs
Under heavier load (larger loops, multiple clients), you’ll see TLS 1.3 usually gives better latency and smoother max values, especially when handshake overhead matters (cold clients).
4. Where to see CPU / memory
You asked:
“Do we have any way to see the load metrics in the code itself?”
We did that with /metrics (per-request latency). For CPU and memory, best is:
🔹 Option A: dotnet-counters (recommended)
Find PID:
dotnet-counters ps
Then:
dotnet-counters monitor --process-id <PID> System.Runtime
Code language: HTML, XML (xml)
Watch:
cpu-usagegc-heap-sizegen-0-gc-countetc.
Run your load loop and watch how TLS 1.2 vs 1.3 behaves.
🔹 Option B: Task Manager
Just open Task Manager → Details → dotnet.exe, watch CPU and Memory while you hit /ping.
5. How to use this in your understanding
- Start with TLS 1.2 (
TLS_VERSION=12). - Run a curl/Postman loop, show
/metrics. - Show CPU/memory with dotnet-counters or Task Manager.
- Switch to TLS 1.3 (
TLS_VERSION=13). - Repeat same load → compare metrics.
- Explain:
- Less handshake overhead
- Better latency
- Lower CPU under same load (especially when doing many short connections).
I’m a DevOps/SRE/DevSecOps/Cloud Expert passionate about sharing knowledge and experiences. I have worked at Cotocus. I share tech blog at DevOps School, travel stories at Holiday Landmark, stock market tips at Stocks Mantra, health and fitness guidance at My Medic Plus, product reviews at TrueReviewNow , and SEO strategies at Wizbrand.
Do you want to learn Quantum Computing?
Please find my social handles as below;
Rajesh Kumar Personal Website
Rajesh Kumar at YOUTUBE
Rajesh Kumar at INSTAGRAM
Rajesh Kumar at X
Rajesh Kumar at FACEBOOK
Rajesh Kumar at LINKEDIN
Rajesh Kumar at WIZBRAND
Find Trusted Cardiac Hospitals
Compare heart hospitals by city and services — all in one place.
Explore Hospitals
This article does an excellent job of explaining how different versions of Transport Layer Security (TLS) impact the performance of .NET applications. It clearly shows why upgrading to a newer version — especially TLS 1.3 — is beneficial: it reduces handshake latency, simplifies cipher suites, and lowers computational overhead, all of which help web services run faster and more securely. The breakdown of how handshake rounds, encryption/decryption cost, and cipher selection affect throughput and responsiveness makes it particularly useful for developers tuning performance under load. In short, this post offers both a clear theoretical foundation and pragmatic guidance for improving security without sacrificing performance.