Yes, we can absolutely do this in one self-contained program 👍
You’ll be able to:
- See GC before/after each scenario
- Trigger Gen0 / Gen1 / Gen2 collections
- Observe heap size and collection counts
- Use this with dotnet-counters / dotMemory / VS profiler if you want
Below is a single Program.cs you can drop into a new console app.
1️⃣ Create the project
dotnet new console -n GcGenerationsDemo
cd GcGenerationsDemo
Code language: JavaScript (javascript)
Replace all contents of Program.cs with this:
2️⃣ How to run and “experience” GC
From inside the project folder:
dotnet run
The program will walk you through:
- Startup stats
- Gen0 scenario – short-lived allocations
- Gen1 scenario – medium-lived allocations
- Gen2 scenario – long-lived allocations
Each step prints:
Gen0/Gen1/Gen2 collection countsTotal managed heap (MB)
You’ll see:
- Gen0 counts jump a lot in the first scenario.
- Gen1 counts increase in the second scenario.
- Gen2 counts and heap size behavior change in the third scenario.
3️⃣ Optional: Watch it live with dotnet-counters
In another terminal, while the app is running:
- Get process list:
dotnet-counters ps - Find your
GcGenerationsDemoPID, then:dotnet-counters monitor --process-id <PID> System.Runtime
Watch:
gc-heap-sizegen-0-gc-countgen-1-gc-countgen-2-gc-count
Run each scenario and you’ll see the counters move in sync with console output.
4️⃣ How this maps to Gen0 / Gen1 / Gen2 concepts
- Gen0 scenario
- Many tiny, short-lived objects
- Mostly collected in Gen0
- You’ll see Gen0 collections spike
- Gen1 scenario
- Objects kept alive briefly in a
List<byte[]> - They survive at least one collection → promoted to Gen1
- We force Gen1 collections and then free references
- You see Gen1 counts increase, heap shrink
- Objects kept alive briefly in a
- Gen2 scenario
- Objects stored in a static list (
LongLivedHolder.Buffers) - They are long-lived; promoted to Gen2
- Even after Gen2 collection, many remain because references are still held
- This is how leaks and long-lived caches behave
- Objects stored in a static list (
1️⃣ How to read the four numbers
Each PrintGcStats gives you:
- Gen0 collections – how many times .NET cleaned short-lived objects
- Gen1 collections – how many times it cleaned objects that survived Gen0
- Gen2 collections – how many times it cleaned long-lived objects
- Total managed heap – how much managed memory is still in use after GC (roughly)
These counters are cumulative since process start.
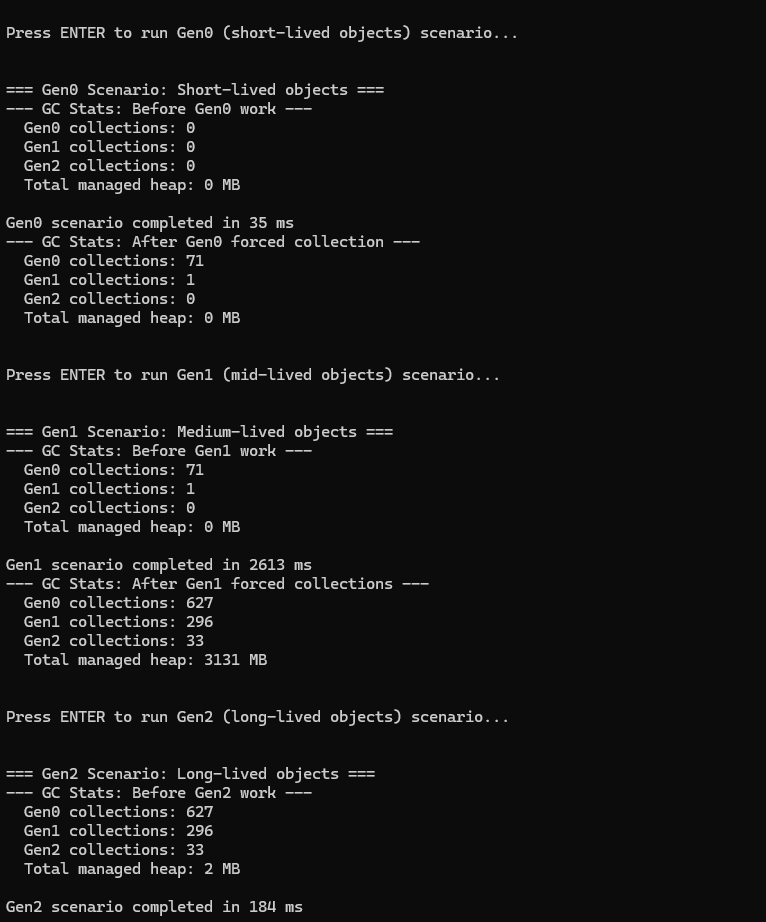
2️⃣ Gen0 scenario – short-lived objects
You saw:
=== Gen0 Scenario: Short-lived objects ===
--- GC Stats: Before Gen0 work ---
  Gen0 collections: 0
  Gen1 collections: 0
  Gen2 collections: 0
  Total managed heap: 0 MB

Gen0 scenario completed in 35 ms
--- GC Stats: After Gen0 forced collection ---
  Gen0 collections: 71
  Gen1 collections: 1
  Gen2 collections: 0
  Total managed heap: 0 MB
What happened?
- We allocated millions of tiny objects in a loop.
- They were not stored anywhere, so they died quickly.
- GC cleaned them mostly in Gen0:
- Gen0 collections:
0 → 71✅
- Gen0 collections:
- A few objects survived briefly → promoted to Gen1 once:
- Gen1 collections:
0 → 1
- Gen1 collections:
- After the forced collection:
Total managed heap: 0 MB(rounded) → means almost nothing left.
👉 Interpretation:
“Lots of short-lived garbage → GC handled it cheaply in Gen0.
We generated a ton of allocations, but the memory was fully reclaimed. No leak, GC working as designed.”
This is typical of request-scoped allocations in APIs when they’re well-behaved.
3️⃣ Gen1 scenario – medium-lived objects
You saw:
=== Gen1 Scenario: Medium-lived objects ===
--- GC Stats: Before Gen1 work ---
  Gen0 collections: 71
  Gen1 collections: 1
  Gen2 collections: 0
  Total managed heap: 0 MB

Gen1 scenario completed in 2613 ms
--- GC Stats: After Gen1 forced collections ---
  Gen0 collections: 627
  Gen1 collections: 296
  Gen2 collections: 33
  Total managed heap: 3131 MB
What did the code do here?
- It allocated a lot of 16 KB buffers and stored them in a
List<byte[]> survivors. - That local list stayed alive for a while → the buffers survived multiple Gen0 collections.
- That caused:
- Gen0 collections:
71 → 627(lots of allocations) - Gen1 collections:
1 → 296(many promotions & cleanups) - Gen2 collections:
0 → 33(some long-lived promotions too)
- Gen0 collections:
Why is heap so big here (3131 MB)?
- Right after the scenario, before the runtime has fully compacted and reused memory,
GetTotalMemorysees ~3 GB still reserved/used. - These objects were just cleared at the end of the scenario (we call
survivors.Clear()and GC.Collect), but this snapshot is still showing that a lot of memory was in play.
Then before the next scenario you saw:
--- GC Stats: Before Gen2 work ---
  ...
  Total managed heap: 2 MB
So eventually the runtime fully reclaimed it, and the heap dropped back down.
👉 Interpretation:
“Here we created objects that lived longer than Gen0 (in a list).
We see big jumps in Gen1 and Gen2 collections and temporary heap growth (~3 GB).
After clearing references and more GC, memory drops back to a few MB → no leak, just heavy temporary pressure.”
This demonstrates:
- Promotion from Gen0 → Gen1 → Gen2
- Longer-lived objects = more expensive GC
- Why you don’t want to keep large collections alive longer than necessary.
4️⃣ Gen2 scenario – long-lived / leaked objects
You saw:
=== Gen2 Scenario: Long-lived objects ===
--- GC Stats: Before Gen2 work ---
  Gen0 collections: 627
  Gen1 collections: 296
  Gen2 collections: 33
  Total managed heap: 2 MB

Gen2 scenario completed in 184 ms
--- GC Stats: After Gen2 forced collection ---
  Gen0 collections: 693
  Gen1 collections: 329
  Gen2 collections: 34
  Total managed heap: 392 MB

Long-lived objects stored: 50000
Note: Because we still keep references, these objects won't be freed.
What did the code do here?
- Allocated 50,000 × 8 KB buffers ≈ ~400 MB.
- Stored them in
LongLivedHolder.Buffers, which isstatic. - We never clear that list → those objects are effectively long-lived.
Even after a full Gen2 collection:
- Gen2 collections:
33 → 34(we forced a full GC) - But heap only drops to:
Total managed heap: 392 MB
- And we still have:
Long-lived objects stored: 50000
👉 Interpretation:
“These are long-lived objects (or a leak).
Even after a full Gen2 GC, almost 400 MB remains because we’re still holding references in a static list.
This is what a memory leak / long-lived cache looks like in production:
Gen2 collections happen, but memory never really goes down.”
This is the pattern you’d see in:
- Static caches that don’t evict
- Static lists/dicts that only grow
- Singletons holding on to big data
- Event handler leaks, etc.
5️⃣ How to explain (short version)
“In the Gen0 scenario, we created millions of tiny, short-lived objects.
GC handled them mostly in Gen0 (71 collections), and after GC, memory is basically 0 MB.
This is healthy, short-lived garbage.
In the Gen1 scenario, we kept objects alive for a while in a list.
They survived Gen0, got promoted to Gen1 and some to Gen2.
We see big Gen1/Gen2 collection counts and temporary heap growth to ~3 GB, but after clearing references, the heap returns to a small size.
This shows the cost of medium-lived objects.
In the Gen2 scenario, we stored 50k buffers in a static list.
Even after a full Gen2 collection, we still use ~392 MB.
Because the app still references these objects, the GC cannot free them.
This is exactly how long-lived objects and memory leaks behave in real .NET apps.”
I’m a DevOps/SRE/DevSecOps/Cloud Expert passionate about sharing knowledge and experiences. I have worked at Cotocus. I share tech blog at DevOps School, travel stories at Holiday Landmark, stock market tips at Stocks Mantra, health and fitness guidance at My Medic Plus, product reviews at TrueReviewNow , and SEO strategies at Wizbrand.
Do you want to learn Quantum Computing?
Please find my social handles as below;
Rajesh Kumar Personal Website
Rajesh Kumar at YOUTUBE
Rajesh Kumar at INSTAGRAM
Rajesh Kumar at X
Rajesh Kumar at FACEBOOK
Rajesh Kumar at LINKEDIN
Rajesh Kumar at WIZBRAND
Find Trusted Cardiac Hospitals
Compare heart hospitals by city and services — all in one place.
Explore Hospitals
This article does an excellent job of breaking down how memory management works in .NET through its generational garbage‑collection strategy. By explaining that new objects start in Gen 0 — where most short‑lived allocations get collected quickly — and that only objects which “survive” get promoted to Gen 1 and eventually Gen 2, it makes clear how GC optimizes for both performance and memory usage. The discussion of how the garbage collector determines which objects are reachable (roots, references, etc.) and safely reclaims unreachable objects helps demystify what often feels like a “black box.” For developers building long‑running applications, this post offers valuable insight into why allocation patterns matter, how GC impacts memory lifetimes, and how to design code to minimize unwanted memory retention.
this article explains very clearly how garbage collection works under the hood in .NET (with .NET / CLR), especially the logic behind generational GC via Garbage Collector (GC) and its “Gen0 → Gen1 → Gen2” model. It shows why most objects — like temporary locals or short‑lived data — go into Gen0, get collected frequently, and rarely promoted, while only longer‑lived survivors move to Gen1, and ultimately Gen2, which keeps long‑lived or “static/ cached” objects. This generational strategy optimizes for performance by avoiding repeated scanning of the entire heap, reclaiming short‑lived objects cheaply, and only occasionally collecting long‑lived data. The article’s example program (with forced collections and heap‑size / collection‑count outputs) is especially useful: it makes abstract GC concepts tangible — you can actually see Gen‑0 spikes with many short‑lived allocations, observe promotions to Gen1/Gen2 with medium‑lived data, and understand how memory‑leaks or long‑lived caches behave when references persist. For anyone designing memory‑sensitive .NET applications, this tutorial is an excellent resource to build intuition about when GC runs, why allocation patterns matter, and how to avoid unintended memory retention.