Below is the definitive, step-by-step list of PerfMon counters you must add for .NET / ASP.NET Core / API / Microservices performance optimization.
This is the same checklist used in enterprise performance engineering, load testing, and production diagnostics.
I will give you:
✔ Exact counters
✔ In step-by-step order
✔ Why each counter matters
✔ Which ones are optional vs mandatory
✔ What values are considered “bad”
This is your final PerfMon Counter Checklist for .NET performance.
STEP-BY-STEP: Add These PerfMon Counters for .NET Application Performance Optimization
🔵 STEP 1 — Add Essential CPU Counters (Mandatory)
✔ Processor
- % Processor Time — _Total
- % Privileged Time — _Total
- % Interrupt Time
- Processor Queue Length (from System)
✔ Process (for your app)
Select instance:
➡ dotnet, w3wp, or yourapp.exe
Add:
- % Processor Time
- Thread Count
- Handle Count
- Private Bytes
- Working Set
- IO Data Bytes/sec
- IO Read Bytes/sec
- IO Write Bytes/sec
Why CPU counters matter
- Detect CPU saturation (>80%)
- Find thread pool starvation
- Detect infinite loops, heavy JSON serialization, LINQ misuse
- Detect high kernel (privileged) usage → drivers, encryption, networking
🟣 STEP 2 — Add Memory Counters (Mandatory)
✔ Memory
- Available MBytes
- % Committed Bytes in Use
- Pages/sec
- Page Reads/sec
- Cache Faults/sec
- Committed Bytes
✔ Process (your app)
- Private Bytes (memory leak indicator)
- Virtual Bytes
- Working Set
- Page Faults/sec
Why Memory counters matter
- Identify memory leaks
- Detect high paging → application slowdown
- Understand GC pressure
- Identify large object allocations
🟢 STEP 3 — Add Disk I/O Counters (Mandatory)
✔ PhysicalDisk
(_Total)
- Avg. Disk Queue Length
- Avg. Disk sec/Read
- Avg. Disk sec/Write
- Disk Reads/sec
- Disk Writes/sec
- Current Disk Queue Length
✔ LogicalDisk
- % Free Space
- Free Megabytes
Why disk counters matter
- Identify disk bottlenecks
- Troubleshoot long API latency caused by slow file or database I/O.
- Detect heavy logging or temp file writes
🟡 STEP 4 — Add Network Counters (Mandatory for API/Web App)
✔ Network Interface
- Bytes Total/sec
- Bytes Received/sec
- Bytes Sent/sec
- Output Queue Length
- Packets/sec
- Packets Outbound Errors
- Packets Received Errors
✔ TCPv4
- Connections Established
- Connection Failures
- Segments Retransmitted/sec
Why network counters matter
- Understand throughput
- Detect API congestion
- Detect retransmissions (network instability)
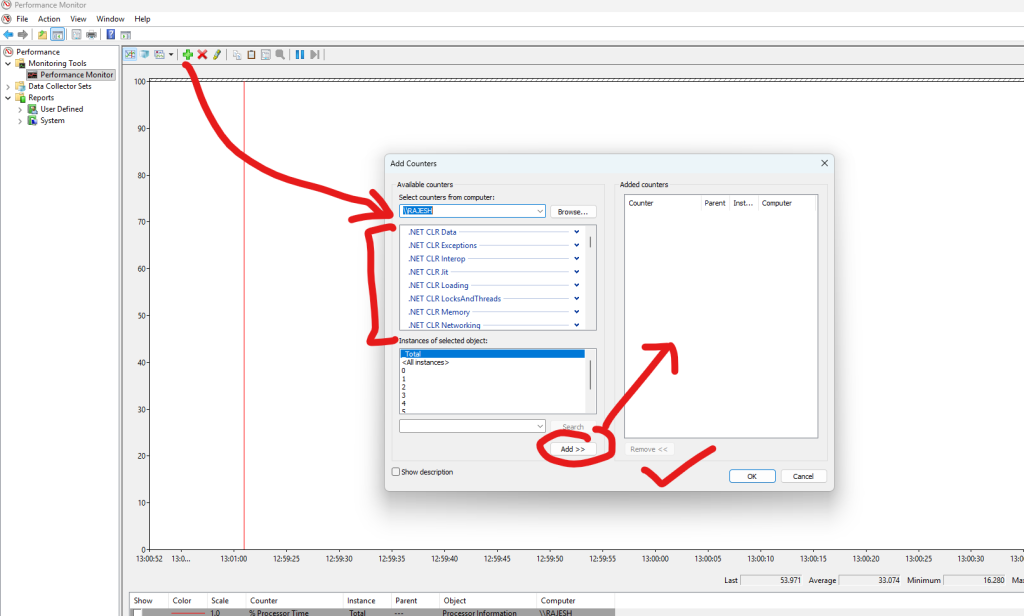
🔴 STEP 5 — Add .NET CLR Counters (CRITICAL for .NET Performance)
➡ In PerfMon UI, expand:
“.NET CLR Memory”
“.NET CLR Exceptions”
“.NET CLR Jit”
“.NET CLR LocksAndThreads”
“.NET CLR Networking”
Select your instance:
dotnet, w3wp, or your application name.
🍀 .NET CLR MEMORY (Very Important)
✔ Add these:
- % Time in GC
- Gen 0 Collections
- Gen 1 Collections
- Gen 2 Collections 🔥
- Large Object Heap Size 🔥
- # Bytes in all Heaps
- Promoted Memory/sec
- Finalization Survivors
- GC Handles
Interpretation:
| Counter | Meaning |
|---|---|
| % Time in GC > 15% | Too much GC blocking = slow app |
| Frequent Gen 2 GC | Memory pressure / large objects |
| High LOH size | Large object allocations causing fragmentation |
| High Promoted MB/sec | Short-lived objects living too long |
🍀 .NET CLR EXCEPTIONS
Add:
- # of Exceptions Thrown/sec
This indicates:
- Poor coding practices
- Bad error handling
- Hidden exceptions killing performance
If > 100/sec consistently → WRONG code.
🍀 .NET CLR LOCKS & THREADS
Add:
- # of current logical Threads
- # of current physical Threads
- Contention Rate/sec
- Queue Length
Indicates:
- Thread pool starvation
- Async deadlocks
- High locking contention
🍀 .NET CLR JIT
Add:
- % Time in JIT
- IL Bytes Jitted/sec
JIT issues appear on:
- Cold starts
- Large reflection / dynamic LINQ usage
🟤 STEP 6 — Add ASP.NET / IIS Counters (If Web App or API)
✔ ASP.NET Applications
(Select your app pool)
Add:
- Requests/Sec
- Requests Queued
- Requests Rejected
- Request Execution Time
- Pipeline Instance Count
✔ ASP.NET
- Application Restarts
- Worker Process Restarts
✔ Web Service
(For old .NET Framework)
- Total Method Requests/sec
✔ WinHTTP Proxy/Service
If using HttpClient extensively.
🔵 STEP 7 — Add Kestrel & Hosting Counters (.NET Core Self-hosted)
If running on Kestrel (non-IIS):
✔ ASP.NET Core Hosting
- Current Requests
- Requests/sec
- Request Queue Length
✔ Kestrel
(Available in dotnet counters, but PerfMon may expose via EventSource)
- Connection queue length
- Active connections
- TLS handshake duration
🟣 STEP 8 — Add SQL Server Counters (If Your App Uses DB)
Category: SQLServer:SQL Statistics
- Batch Requests/sec
- Compilations/sec
- Re-Compilations/sec
Category: SQLServer:Buffer Manager
- Buffer cache hit ratio
- Page life expectancy (PLE)
Category: SQLServer:General Statistics
- User Connections
- Processes blocked
Category: SQLServer:Wait Statistics
- Lock waits/sec
- Latch waits/sec
These help detect:
- Query bottlenecks
- High CPU SQL queries
- Plan cache issues
- Memory pressure
🎯 FINAL: Complete List (Copy-Paste Checklist)
Here is the single list you can paste into training material:
✔ CPU
- Processor → % Processor Time (_Total)
- Processor → % Privileged Time
- Processor → % Interrupt Time
- System → Processor Queue Length
- Process(dotnet/w3wp/app.exe) → % Processor Time
- Thread Count
- Handle Count
✔ Memory
- Memory → Available MBytes
- Memory → % Committed Bytes
- Memory → Pages/sec
- Process → Private Bytes
- Process → Page Faults/sec
- Process → Working Set
✔ Disk
- Avg. Disk Queue Length
- Avg. Disk sec/Read
- Avg. Disk sec/Write
- Disk Reads/sec
- Disk Writes/sec
✔ Network
- Bytes Total/sec
- TCP Retransmissions/sec
- Connections Established
- Packets Errors
✔ .NET CLR Memory
- % Time in GC
- Gen 0/1/2 Collections
- Promoted MB/sec
- Bytes in All Heaps
- LOH Size
✔ .NET CLR Exceptions
- Exceptions/sec
✔ .NET CLR LocksAndThreads
- Contention Rate/sec
- Logical Threads
- Physical Threads
✔ ASP.NET / Hosting
- Requests/sec
- Current Requests
- Request Queue Length
- Request Execution Time
✔ SQL Server
- Batch Requests/sec
- SQL Compilations/sec
- SQL Re-compilations/sec
- Buffer Cache Hit Ratio
- Page Life Expectancy
I’m a DevOps/SRE/DevSecOps/Cloud Expert passionate about sharing knowledge and experiences. I have worked at Cotocus. I share tech blog at DevOps School, travel stories at Holiday Landmark, stock market tips at Stocks Mantra, health and fitness guidance at My Medic Plus, product reviews at TrueReviewNow , and SEO strategies at Wizbrand.
Do you want to learn Quantum Computing?
Please find my social handles as below;
Rajesh Kumar Personal Website
Rajesh Kumar at YOUTUBE
Rajesh Kumar at INSTAGRAM
Rajesh Kumar at X
Rajesh Kumar at FACEBOOK
Rajesh Kumar at LINKEDIN
Rajesh Kumar at WIZBRAND
Find Trusted Cardiac Hospitals
Compare heart hospitals by city and services — all in one place.
Explore Hospitals