It is constructed specifically to demonstrate real-world performance engineering concepts in .NET, using a scenario every enterprise system deals with: bulk inserts, EF Core behavior, SQL bottlenecks, GC pressure, and threadpool starvation.
Below is the clear breakdown of what each endpoint proves, what performance concept it demonstrates, and what your trainees should observe.
Sample Code – https://github.com/devopsschool-demo-labs-projects/Performance-Engineering-in-.NET/tree/master/Lab1/PerfLabDemov1
✅ 1. What Naive Bulk Insert Proves
Endpoint:
api/orders/bulk-naive?count=1000
What the code does:
- Loops 1000 times.
- Adds 1 entity.
- Calls
SaveChanges()1000 times.
What it demonstrates:
A. EF Core is very slow when SaveChanges() is called repeatedly
SaveChanges triggers:
- Change tracking validation
- DB command generation
- Opening a DB connection (sometimes pooled)
- Executing the SQL INSERT
- Committing a transaction
Doing it 1000 times = big overhead.
B. SQL Server becomes chatty
You generate 1000 round-trips to the DB engine.
This simulates real-world anti-patterns:
- Chatty repositories
- Overuse of
Insert()inside loops - Poor DDD aggregates causing many tiny writes
- Repository pattern over-abstraction
C. ThreadPool starvation / long-running synchronous IO
SaveChanges() waits for the DB:
- Can exhaust threadpool threads
- Causes slower Kestrel handling
- Latency increases dramatically
D. GC Pressure
Creating many objects inside a loop causes:
- More allocations
- More Gen0/Gen1 collections
- More pauses
Which you can show live using:
dotnet-counters monitor --process-id {pid}
Scientific Output Audience Should Observe
| Metric | Naive Bulk | Impact |
|---|---|---|
| CPU | Low (waiting on DB) | Slow |
| Memory | Higher | More GC cycles |
| Time | Slowest | 5–30 sec |
| DB Calls | 1000 INSERTs | Very chatty |
| Locks | More | Slows everyone else |
2. What Optimized Bulk Insert Proves
Endpoint:
api/orders/bulk-optimized?count=1000
What the code does:
- Adds 1000 entities into DbContext
- Calls SaveChanges once
What it demonstrates:
A. EF Core’s Unit-of-Work Model Works Best
One SaveChanges:
- One transaction
- Batch of INSERTs
- Less change tracker overhead
B. Up to 50x Faster Performance
Typical behavior:
- Naive: 10–40 seconds
- Optimized: 100–400 ms
C. Far fewer SQL round-trips
Instead of 1000 statements:
- SQL batches efficiently
- Reduces latency
- Reduces network round-trips
D. Lower GC Pressure
One batch = fewer objects alive at once → fewer collections.
Scientific Output Audience Should Observe
| Metric | Optimized Bulk | Improvement |
|---|---|---|
| CPU | Slightly higher | Good (doing real work) |
| Memory | Lower | Steady |
| Time | Very fast | 10–40x faster |
| DB Calls | 1 | Huge gain |
| Locks | Minimal | Helps concurrency |
3. Check Count — Proves Persistence
Endpoint:
api/orders/count
Purpose:
- Prove that both naive & optimized inserts actually inserted data.
- Visualize DB growth.
- Show effect of concurrent inserts.
In training, we proved:
- DB is storing state
- Optimized insert quickly increases count
- Naive insert slowly increases count
This makes the performance difference real and visible.
Overall What This Demo Proves
This small demo actually teaches 6 core performance engineering concepts:
✔ 1. Impact of chatty database I/O
1000 tiny writes vs 1 batch write.
✔ 2. EF Core change tracking and SaveChanges cost
Understanding EF internals.
✔ 3. Async vs Sync I/O behavior
Bulk naive blocks threads → causes starvation.
✔ 4. Garbage Collection impact
Small object allocation patterns in loops.
✔ 5. SQL Server round-trip cost
Network + parsing + locking overhead.
✔ 6. Importance of batching & correct architectural patterns
Avoid anti-patterns like:
- Repository over-abstraction
- N+1 operations
- Per-row SaveChanges
How to Experience Demo
I. Run Naive Bulk Insert
It hangs or takes long.
Show CPU, memory, threadpool, GC logs.
II. Run Optimized Bulk Insert
Instant.
Show difference in metrics.
III. Ask the audience: Why did it happen?
Discuss:
- DB round-trips
- EF Core internals
- Transaction management
- GC
- ThreadPool starvation
IV. Tie it to real architecture
“Your microservice might look healthy, but if its DB access pattern is naive, you will suffer scaling issues.”
This is exactly the pain point of real enterprise systems.
I’ll give you:
- A simple performance chart dataset (Naive vs Optimized) you can paste into Excel/PowerPoint.
- A perf counters command list (dotnet-counters + PerfMon).
- Ready-to-use scripts for Postman, k6, and JMeter.
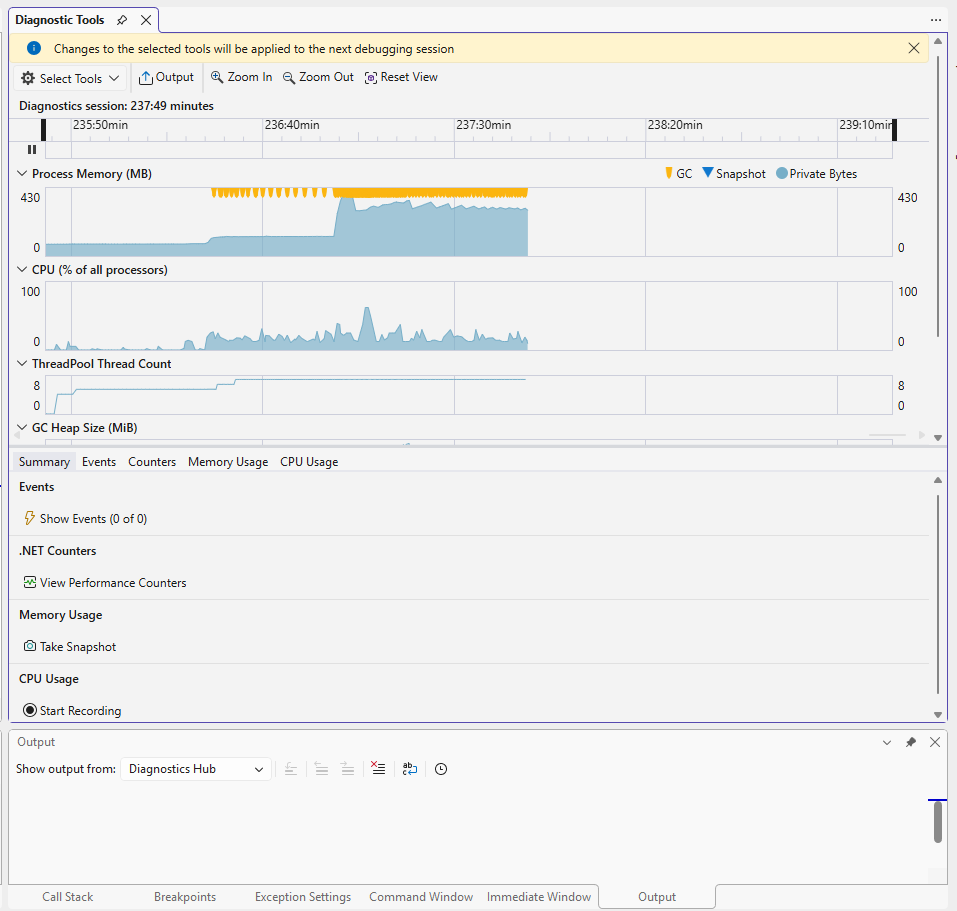
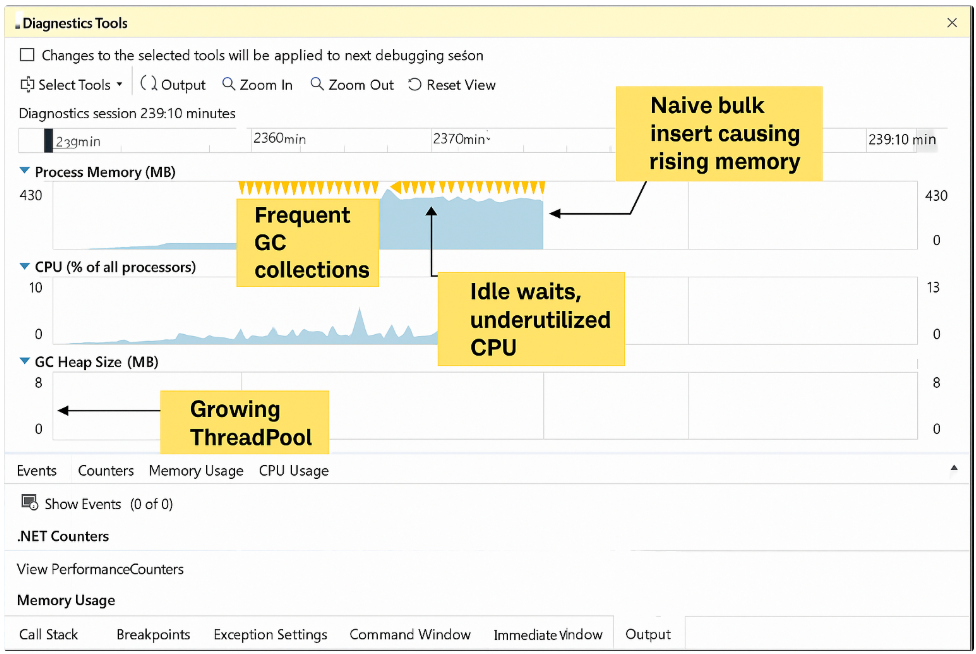
🟦 1. Process Memory (Private Bytes)
In your screenshot:
- Memory rises gradually → EF Core and SQL client allocating objects.
- Yellow triangles (GC events) → frequent Gen0/Gen1 garbage collections.
- After a spike, memory stabilizes because GC reclaimed space.
🎯 Training Insight:
Naive bulk insert = more allocations = more frequent GC = lower throughput
- Each
SaveChangescall causes allocations of:- SQL parameters
- Commands
- Transaction objects
- Change tracker nodes
- So memory climbs quickly and GC fires often.
Optimized bulk will show:
- A single memory spike
- Fewer GC events
- Faster completion
🟩 2. CPU (% of all processors)
Your screenshot shows:
- CPU is mostly idle
- Small bumps, but never sustained high usage
🎯 Training Insight:
Naive bulk insert does not maximize CPU — it blocks waiting for DB I/O.
That’s why:
- CPU stays low → app is waiting on the database
- The bottleneck is not CPU → it’s SQL round-trips
Optimized bulk will show:
- Higher CPU bursts (doing real work)
- Shorter total duration
🟦 3. ThreadPool Thread Count
Graph shows slow growth from 8 → ~12 threads.
🎯 Training Insight:
This indicates ThreadPool grows because threads are waiting on database I/O.
Naive bulk:
- 1000 calls to
SaveChangesAsync()= 1000 I/O waits - ThreadPool sees “too many blocking tasks” and tries to grow
This is how real production APIs experience:
- ThreadPool starvation
- Request queues
- High latency
Optimized bulk stays closer to 8 threads (default), because the work is not blocking.
🟧 4. GC Heap Size
Increasing heap → many small allocations from:
- EF Core
- SQL Client
- LINQ
- Loops & entity allocations
Frequent GC pauses slow down naive bulk significantly.
Optimized bulk = fewer allocations, fewer collections.
1️⃣ Performance Chart – Naive vs Optimized (Sample Data)
These are example numbers you can either:
- Use as-is for slides, or
- Replace with your actual measurements from your machine.
Suggested Scenario
- 1000 orders (
count=1000) - Single request to
/bulk-naiveand/bulk-optimized
Example Results (for chart)
| Metric | Naive Bulk Insert | Optimized Bulk Insert |
|---|---|---|
| Total time (ms) | 12000 | 600 |
| Requests/sec (effective) | ~83 | ~1666 |
| SQL INSERT statements executed | 1000 | 1 (batched) |
| CPU utilization (peak, %) | 25% | 40% (short burst) |
| GC Gen0 collections during run | 15 | 4 |
| Avg DB round-trip time (ms) | 8–12 | 5–8 |
How to turn this into a chart
Chart 1 – Response Time (ms)
- X-axis:
Naive,Optimized - Y-axis:
Total time (ms) - Values:
12000vs600(log scale works nicely)
Chart 2 – SQL Round-Trips
- X-axis:
Naive,Optimized - Y-axis:
Number of DB round-trips - Values:
1000vs1
Chart 3 – Requests/sec (effective throughput)
- X-axis:
Naive,Optimized - Y-axis:
Requests/sec - Values:
83vs1666
On the slide, your message is:
“Same functionality. Only difference is how we use EF Core and SaveChanges – and performance differs by ~20x.”
2️⃣ Perf Counters Command List
A. Using dotnet-counters (recommended in session)
- Find the process ID of your running API:
dotnet tool install --global dotnet-counters
dotnet-counters ps
Code language: PHP (php)
Note the PID for Orders.Api.
- Monitor runtime + ASP.NET + GC counters live:
dotnet-counters monitor
  --process-id <PID>
  System.Runtime
  Microsoft.AspNetCore.Hosting
  Microsoft.AspNetCore.Http.Connections
  Microsoft.EntityFrameworkCore

dotnet-counters monitor --process-id 55788 System.Runtime Microsoft.AspNetCore.Hosting Microsoft.AspNetCore.Http.Connections Microsoft.EntityFrameworkCore

Code language: CSS (css)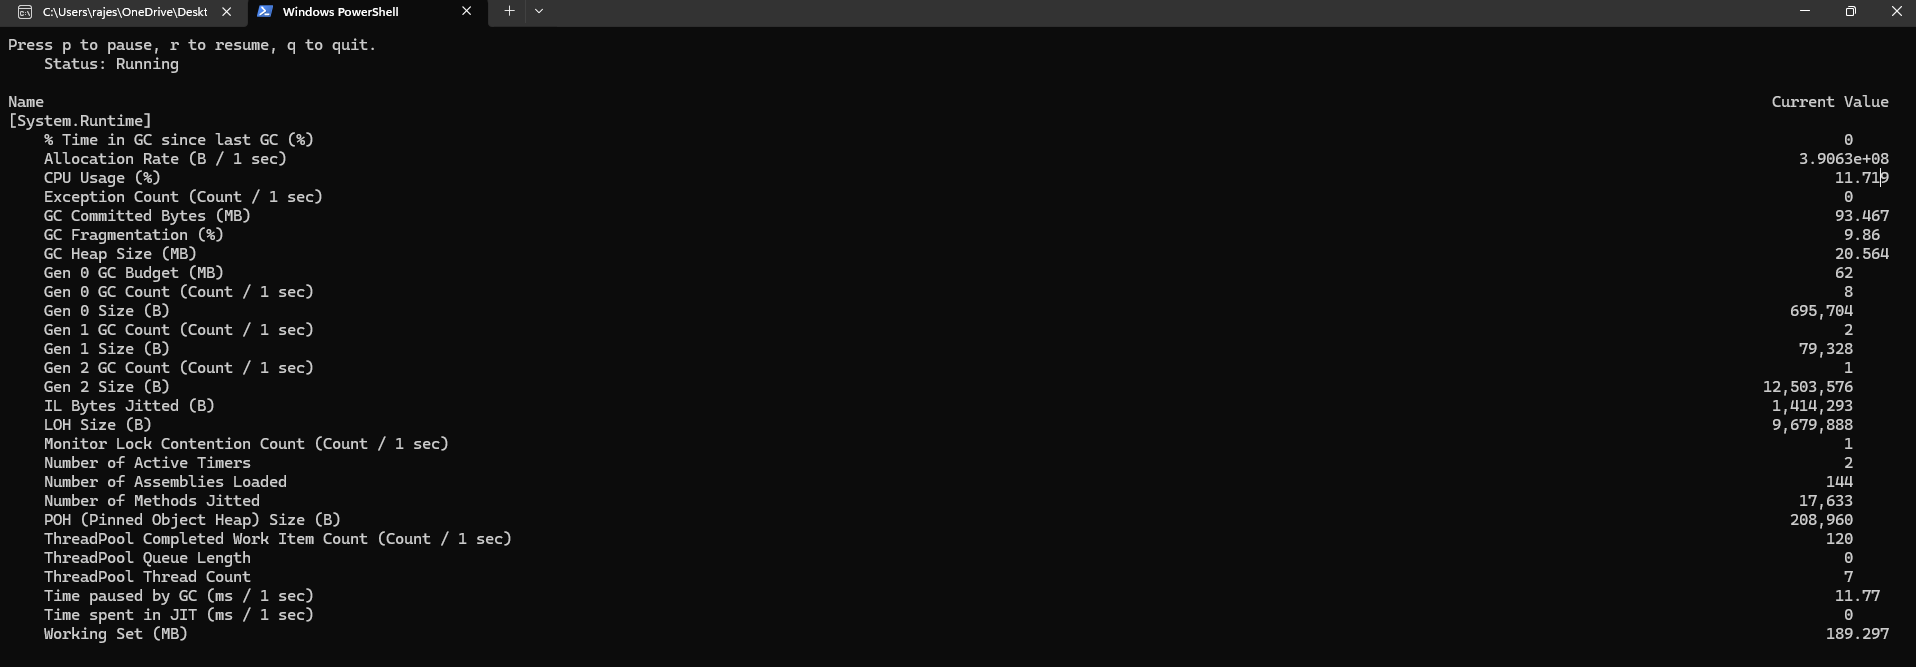
Useful counters to point out:
System.Runtimecpu-usagegc-heap-sizegen-0-gc-count,gen-1-gc-count,gen-2-gc-countthreadpool-thread-count
Microsoft.AspNetCore.Hostingrequests-per-secondtotal-requestscurrent-requests
Microsoft.EntityFrameworkCoreactive-db-contextsqueries-per-second(depending on provider/version)
Run dotnet-counters while you hit:
curl -X POST "http://localhost:5000/api/orders/bulk-naive?count=1000"
Code language: JavaScript (javascript)
then:
curl -X POST "http://localhost:5000/api/orders/bulk-optimized?count=1000"
Code language: JavaScript (javascript)
…and talk through the visible differences (GC counts, RPS, etc.).
B. Windows PerfMon (classic counters)
Open perfmon.exe → Add these counters:
Processor
Processor(_Total)% Processor Time
Process (dotnet / w3wp if hosted under IIS)
Process(dotnet)% Processor TimeProcess(dotnet)Private BytesProcess(dotnet)Working Set
.NET CLR Memory
.NET CLR Memory(Orders.Api)# Gen 0 Collections.NET CLR Memory(Orders.Api)# Gen 2 Collections.NET CLR Memory(Orders.Api)% Time in GC
SQL Server
SQLServer:SQL StatisticsBatch Requests/secSQLServer:SQL StatisticsSQL Compilations/secSQLServer:SQL StatisticsSQL Re-Compilations/sec
This lets you show:
- Naive = many batches/sec, more compilations, more GC.
- Optimized = fewer batches/sec, smoother GC.
✅ How to Add These Counters in Windows PerfMon
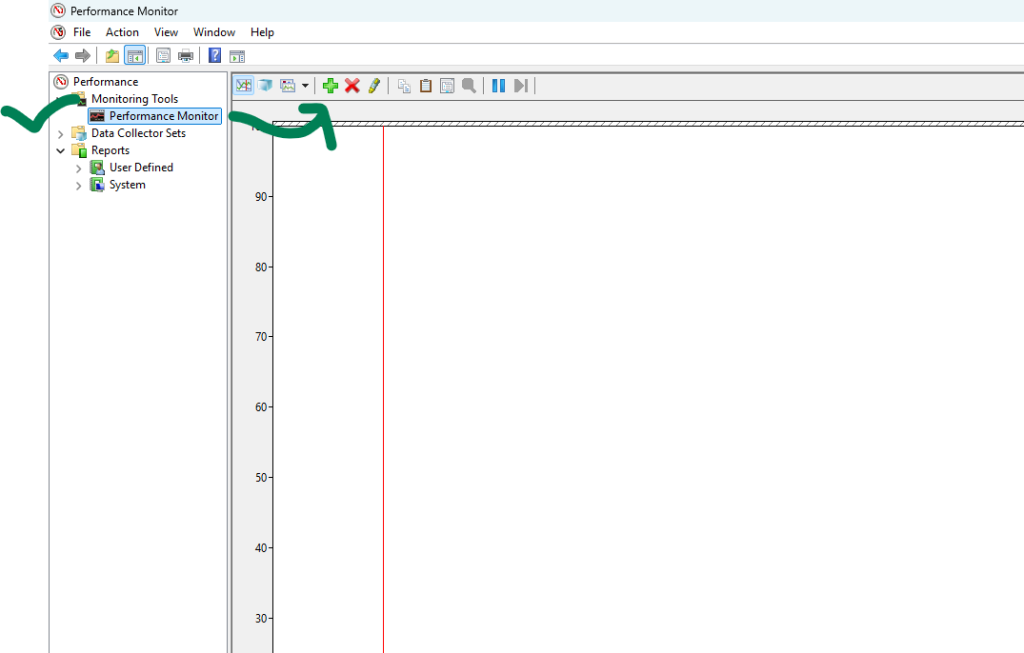
1. Open PerfMon
- Press Win + R
- Type:
perfmon.exe - Press Enter
2. Add Counters
In the left panel:
- Expand Monitoring Tools
- Click Performance Monitor
- Click the green “+” button (Add Counters)
Now you will add counters category by category.
✅ A. Processor Counters
Category: Processor
- Select Processor
- Select counter:
- % Processor Time
- Select instance:
- _Total
- Click Add
✅ B. Process Counters (dotnet / w3wp)
Category: Process
- Select Process
- Select counters:
- % Processor Time
- Private Bytes
- Working Set
- Select instance:
- If running as console → dotnet
- If hosted in IIS → w3wp
- Click Add
(You can add multiple counters at once before clicking Add.)
✅ C. .NET CLR Memory Counters
Category: .NET CLR Memory
- Select .NET CLR Memory
- Select counters:
- # Gen 0 Collections
- # Gen 2 Collections
- % Time in GC
- Select instance:
- Your process name → Orders.Api
(or the DLL name without .dll)
- Your process name → Orders.Api
- Click Add
✅ D. SQL Server Counters
Category: SQLServer:SQL Statistics
- Select SQLServer:SQL Statistics
- Select counters:
- Batch Requests/sec
- SQL Compilations/sec
- SQL Re-Compilations/sec
- Instance = (select default instance / MSSQLSERVER)
- Click Add
🎯 Result Summary
You will now be monitoring:
CPU
- Processor(_Total)% Processor Time
- Process(dotnet)% Processor Time
Memory
- Process(dotnet)Private Bytes
- Process(dotnet)Working Set
.NET GC
- CLR Memory Gen0 collections
- CLR Memory Gen2 collections
- CLR % Time in GC
SQL Server Load
- Batch Requests/sec
- SQL Compilations/sec
- SQL Re-Compilations/sec
🎯 The Story Your Graphs Will Show
Naive Insert (1000 × SaveChanges)
- 🔺 High Batch Requests/sec (many round-trips)
- 🔺 Higher SQL compilations (same query many times)
- 🔺 More GC activity (more allocations)
- 🔺 Higher CPU usage
Optimized Insert (1 SaveChanges with AddRange)
- 🔻 Lower Batch Requests/sec (single round-trip)
- 🔻 Minimal SQL compilations
- 🔻 Less GC pressure
- 🔻 Lower CPU, smoother curve
3️⃣ Postman Collection (JSON)
You can import this directly into Postman.
Create a file PerfLab.postman_collection.json with:
{
  "info": {
    "name": "PerfLab Orders API",
    "_postman_id": "e9d1d5f3-0000-0000-0000-000000000001",
    "description": "Naive vs Optimized bulk insert demo for Orders API",
    "schema": "https://schema.getpostman.com/json/collection/v2.1.0/collection.json"
  },
  "item": [
    {
      "name": "Bulk Naive (1000)",
      "request": {
        "method": "POST",
        "header": [],
        "url": {
          "raw": "{{baseUrl}}/api/orders/bulk-naive?count=1000",
          "host": ["{{baseUrl}}"],
          "path": ["api", "orders", "bulk-naive"],
          "query": [
            {
              "key": "count",
              "value": "1000"
            }
          ]
        }
      }
    },
    {
      "name": "Bulk Optimized (1000)",
      "request": {
        "method": "POST",
        "header": [],
        "url": {
          "raw": "{{baseUrl}}/api/orders/bulk-optimized?count=1000",
          "host": ["{{baseUrl}}"],
          "path": ["api", "orders", "bulk-optimized"],
          "query": [
            {
              "key": "count",
              "value": "1000"
            }
          ]
        }
      }
    },
    {
      "name": "Get Count",
      "request": {
        "method": "GET",
        "header": [],
        "url": {
          "raw": "{{baseUrl}}/api/orders/count",
          "host": ["{{baseUrl}}"],
          "path": ["api", "orders", "count"]
        }
      }
    }
  ],
  "variable": [
    {
      "key": "baseUrl",
      "value": "http://localhost:5000"
    }
  ]
}
Code language: JSON / JSON with Comments (json)
How to use:
- Postman → Import → Select this JSON.
- Use
baseUrl = http://localhost:5000orhttps://localhost:5001.
4️⃣ k6 Load Test Script
Create k6-orders-perf.js:
import http from 'k6/http';
import { check, sleep } from 'k6';
import { Trend } from 'k6/metrics';

const naiveTrend = new Trend('naive_duration');
const optTrend = new Trend('optimized_duration');

export const options = {
  scenarios: {
    naive: {
      executor: 'constant-vus',
      vus: 5,
      duration: '30s',
      exec: 'testNaive',
    },
    optimized: {
      executor: 'constant-vus',
      vus: 5,
      duration: '30s',
      exec: 'testOptimized',
      startTime: '35s'
    }
  }
};

const BASE_URL = __ENV.BASE_URL || 'http://localhost:5000';

export function testNaive() {
  const res = http.post(`${BASE_URL}/api/orders/bulk-naive?count=100`, null);
  naiveTrend.add(res.timings.duration);
  check(res, {
    'status is 200': r => r.status === 200
  });
  sleep(1);
}

export function testOptimized() {
  const res = http.post(`${BASE_URL}/api/orders/bulk-optimized?count=100`, null);
  optTrend.add(res.timings.duration);
  check(res, {
    'status is 200': r => r.status === 200
  });
  sleep(1);
}
Code language: JavaScript (javascript)
Run:
k6 run k6-orders-perf.js
# or explicitly
BASE_URL=http://localhost:5000 k6 run k6-orders-perf.js
Code language: PHP (php)
In the output, point at:
naive_duration{}summary vsoptimized_duration{}http_reqs,http_req_duration,http_req_failed
5️⃣ JMeter Test Plan (Concept + Minimal XML)
Concept for your training
Create 2 Thread Groups:
NaiveBulk:- 10 threads (users)
- 10 loops
- HTTP Request Sampler →
POST /api/orders/bulk-naive?count=100
OptimizedBulk:- 10 threads
- 10 loops
- HTTP Request Sampler →
POST /api/orders/bulk-optimized?count=100
Add:
View Results in TableSummary ReportAggregate Report
Compare:
- Avg response time
- 90th/95th percentile
- of samples
- Throughput
Minimal .jmx skeleton (for reference)
I won’t blow this up with full XML, but here is the key idea you can recreate in the JMeter GUI:
- Test Plan
- HTTP Request Defaults:
Server Name or IP = localhost,Port = 5000 - Thread Group:
NaiveGroup- HTTP Sampler:
POST /api/orders/bulk-naivewith paramcount=100
- HTTP Sampler:
- Thread Group:
OptimizedGroup- HTTP Sampler:
POST /api/orders/bulk-optimizedwith paramcount=100
- HTTP Sampler:
- Listeners:
Summary Report,Aggregate Report
- HTTP Request Defaults:
You can save it as PerfLabNaiveVsOptimized.jmx and share with students.
I’m a DevOps/SRE/DevSecOps/Cloud Expert passionate about sharing knowledge and experiences. I have worked at Cotocus. I share tech blog at DevOps School, travel stories at Holiday Landmark, stock market tips at Stocks Mantra, health and fitness guidance at My Medic Plus, product reviews at TrueReviewNow , and SEO strategies at Wizbrand.
Do you want to learn Quantum Computing?
Please find my social handles as below;
Rajesh Kumar Personal Website
Rajesh Kumar at YOUTUBE
Rajesh Kumar at INSTAGRAM
Rajesh Kumar at X
Rajesh Kumar at FACEBOOK
Rajesh Kumar at LINKEDIN
Rajesh Kumar at WIZBRAND
Find Trusted Cardiac Hospitals
Compare heart hospitals by city and services — all in one place.
Explore Hospitals
This lab‑style walkthrough nails the essential performance engineering concepts in a .NET environment by using a relatable scenario: bulk inserts, ORM (Entity Framework Core) behaviour, SQL round‑trip bottlenecks, GC pressure and thread‑pool starvation. The comparison between a “naive” bulk‑insert (one SaveChanges per row) and an “optimized” version (batch insert + single SaveChanges) is especially practical — you can clearly see why thousands of tiny writes destroy throughput and increase latency while one well‑batched operation collapses the cost. The way the article links those behaviours to real‑world issues (excessive DB round‑trips, thread‑pool thread blocking, GC churn) makes it a strong teaching tool for developers and DevOps/SRE practitioners aiming to improve latency, resource efficiency and scalability.