What is Newrelic Browser? and How Method to enable them?
New Relic Browser is a JavaScript library which is injected into your HTML documents to get detailed information about how your front-end code is executing on your users’ browsers. New Relic Browser will
show you JS errors broken down by browser, geographic response times and even full session traces of user engagement with your website.
New Relic Browser can be setup automatically by simply installing New Relic APM on your backend and turning it on via the web interface or by copy/pasting the JavaScript directly into your HTML pages.
This is accomplished by measuring the time it takes for your users’ browsers to download and render your web pages by injecting a small amount of JavaScript code into the header and footer of each page.By default the agent automatically inserts API calls in compiled JSPs to inject the monitoring JavaScript into web pages. Not all rendering engines are supported.
New Relic Browser uses following way to instrument your app’s webpages.
- JavaScript snippet or
- “agent”
The JavaScript collects data for browser monitoring. To install the New Relic Browser agent, you can choose from a number of deployment options.


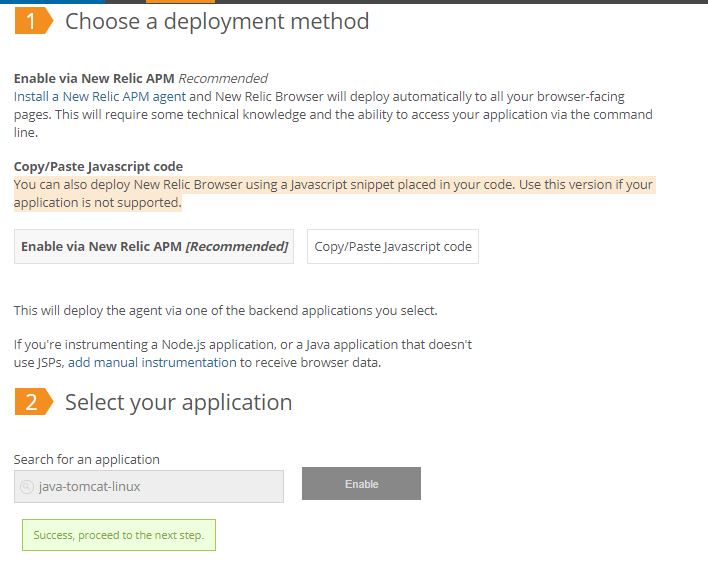
Method 1 – Enable via New Relic APM
Install a New Relic APM agent and New Relic Browser will deploy automatically to all your browser-facing pages. This will require some technical knowledge and the ability to access your application via the command line.
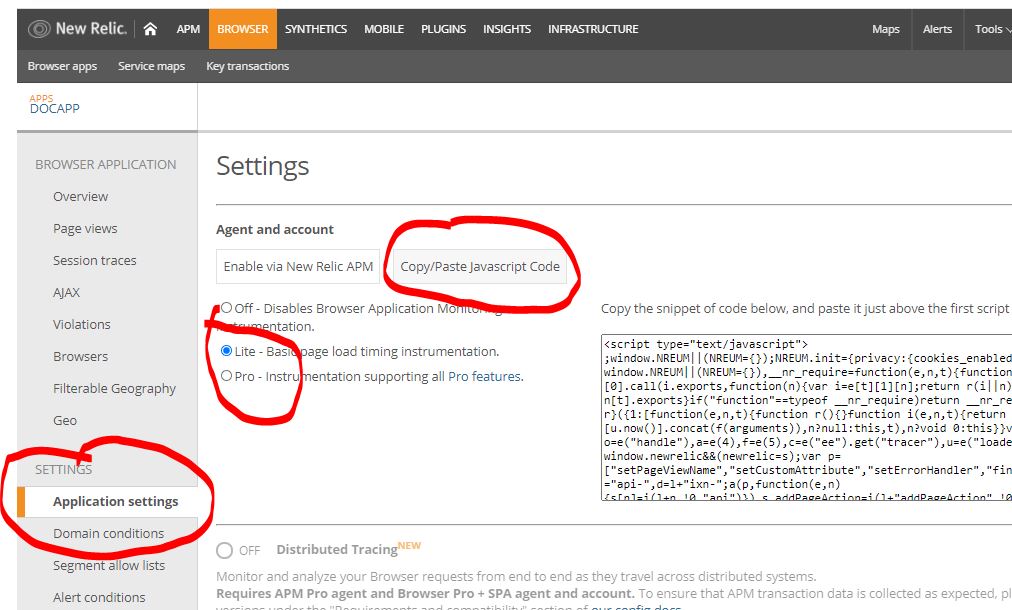
Method 2 – Copy/Paste Javascript code
You can also deploy New Relic Browser using a Javascript snippet placed in your code. Use this version if your application is not supported.
I’m a DevOps/SRE/DevSecOps/Cloud Expert passionate about sharing knowledge and experiences. I have worked at Cotocus. I share tech blog at DevOps School, travel stories at Holiday Landmark, stock market tips at Stocks Mantra, health and fitness guidance at My Medic Plus, product reviews at TrueReviewNow , and SEO strategies at Wizbrand.
Do you want to learn Quantum Computing?
Please find my social handles as below;
Rajesh Kumar Personal Website
Rajesh Kumar at YOUTUBE
Rajesh Kumar at INSTAGRAM
Rajesh Kumar at X
Rajesh Kumar at FACEBOOK
Rajesh Kumar at LINKEDIN
Rajesh Kumar at WIZBRAND
Find Trusted Cardiac Hospitals
Compare heart hospitals by city and services — all in one place.
Explore Hospitals
