Introduction
AI SRE Troubleshooting Assistants help Site Reliability Engineering teams detect, investigate, analyze, and resolve infrastructure, application, networking, and observability issues faster using AI-powered operational intelligence. These platforms combine logs, metrics, traces, alerts, incident timelines, infrastructure metadata, deployment history, and automation workflows to reduce operational noise and accelerate root cause analysis.
Modern production systems are increasingly distributed across Kubernetes clusters, multi-cloud environments, serverless workloads, APIs, AI applications, and microservices architectures. Traditional troubleshooting approaches often require engineers to manually correlate logs, metrics, dashboards, deployment timelines, alerts, and incident histories across multiple tools. AI-powered SRE assistants reduce this operational burden by automating investigation workflows and surfacing likely causes, anomalies, and remediation suggestions.
Why It Matters
Downtime, alert fatigue, slow incident response, and operational complexity create major business risk for digital organizations. SRE teams increasingly need systems that can summarize incidents, prioritize alerts, correlate telemetry, analyze deployment impact, and guide remediation workflows conversationally or autonomously.
AI SRE Troubleshooting Assistants help organizations improve reliability, reduce mean time to detection, reduce mean time to resolution, and improve operational collaboration. These tools are especially useful for cloud-native organizations, SaaS providers, platform engineering teams, DevOps-heavy enterprises, Kubernetes operators, and organizations managing high-scale distributed systems.
Real World Use Cases
- AI-powered root cause analysis
- Kubernetes incident troubleshooting
- Log anomaly investigation
- Alert correlation and prioritization
- Multi-cloud operational visibility
- Deployment impact analysis
- AI-assisted remediation workflows
- Infrastructure dependency analysis
- Service degradation investigation
- Automated operational summaries
Evaluation Criteria for Buyers
When evaluating AI SRE Troubleshooting Assistants, buyers should consider:
- Root cause analysis accuracy
- Observability integration depth
- Log, metrics, and traces correlation quality
- Kubernetes and cloud-native support
- Incident summarization capabilities
- Alert noise reduction effectiveness
- Automation and remediation workflows
- Security and RBAC controls
- Multi-cloud compatibility
- AI explainability and transparency
- Workflow customization support
- Governance and auditability
Best for: SRE teams, DevOps engineers, platform engineering groups, cloud-native operations teams, SaaS companies, enterprise infrastructure teams, and organizations operating distributed systems at scale.
Not ideal for: organizations with minimal operational complexity, teams lacking observability maturity, or environments where infrastructure automation and AI-assisted remediation are heavily restricted.
What’s Changed in AI SRE Troubleshooting Assistants
- AI-powered incident summarization is becoming more accurate.
- Root cause analysis workflows increasingly combine logs, traces, metrics, and deployment metadata.
- AI copilots now guide engineers through remediation workflows conversationally.
- Kubernetes troubleshooting automation is becoming significantly more advanced.
- Multi-cloud operational visibility is increasingly integrated.
- AI systems are improving alert prioritization and noise reduction.
- SRE platforms increasingly support autonomous operational investigation.
- AI-assisted remediation suggestions are becoming more context-aware.
- Operational governance and auditability are becoming mandatory for enterprise adoption.
- Observability vendors are embedding AI directly into troubleshooting workflows.
- Infrastructure dependency mapping is becoming AI-assisted.
- ChatOps integration is becoming central to operational collaboration.
Quick Buyer Checklist
- Can the platform correlate logs, metrics, and traces automatically?
- Does it support Kubernetes and cloud-native troubleshooting?
- Can it summarize incidents accurately?
- Does it reduce alert noise effectively?
- Can it analyze deployment impact?
- Does it support AI-assisted remediation workflows?
- Are RBAC and governance controls available?
- Can it integrate with existing observability platforms?
- Does it support multi-cloud environments?
- Are audit logs and operational approvals available?
- Can workflows be customized safely?
- Does it support ChatOps and collaboration workflows?
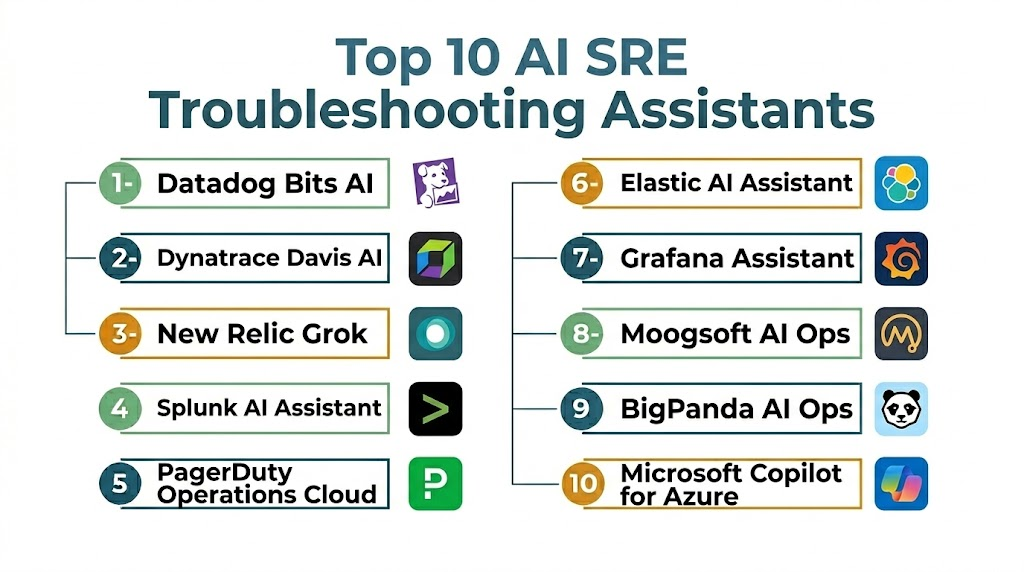
Top 10 AI SRE Troubleshooting Assistants
1- Datadog Bits AI
2- Dynatrace Davis AI
3- New Relic Grok
4- Splunk AI Assistant
5- PagerDuty Operations Cloud
6- Elastic AI Assistant
7- Grafana Assistant
8- Moogsoft AI Ops
9- BigPanda AI Ops
10- Microsoft Copilot for Azure
#1 — Datadog Bits AI
One-line verdict: Best for AI-assisted observability analysis and cloud-native troubleshooting workflows.
Short description:
Datadog Bits AI helps SRE and DevOps teams investigate incidents, analyze observability data, summarize alerts, and accelerate troubleshooting across cloud-native environments.
Standout Capabilities
- AI-powered observability analysis
- Alert summarization
- Log and metrics correlation
- Infrastructure troubleshooting
- Cloud-native visibility
- Kubernetes operational workflows
- AI-assisted investigation support
AI-Specific Depth
- Model support: Hosted AI workflows
- RAG / knowledge integration: Observability telemetry and infrastructure metadata
- Evaluation: Incident investigation workflows
- Guardrails: Enterprise RBAC and governance controls
- Observability: Deep metrics, logs, traces, and infrastructure visibility
Pros
- Strong observability integration
- Excellent troubleshooting workflows
- Useful cloud-native operational intelligence
Cons
- Best suited for Datadog ecosystems
- Enterprise pricing can scale significantly
- Multi-platform flexibility varies
Security & Compliance
Enterprise governance, RBAC, SSO, audit logs, and operational permissions vary by deployment and plan.
Deployment & Platforms
- Cloud-hosted
- Web-based
- Slack integrations
- Kubernetes support
Integrations & Ecosystem
Datadog Bits AI integrates deeply into cloud-native observability workflows.
- Kubernetes
- AWS
- Azure
- GCP
- Logs
- Metrics
- Traces
- Incident workflows
Pricing Model
Usage and enterprise pricing vary.
Best-Fit Scenarios
- Cloud-native observability
- SRE troubleshooting
- Kubernetes incident analysis
#2 — Dynatrace Davis AI
One-line verdict: Best for enterprise AI-driven root cause analysis and autonomous observability workflows.
Short description:
Dynatrace Davis AI helps organizations automate root cause analysis, infrastructure monitoring, application troubleshooting, and operational intelligence workflows.
Standout Capabilities
- Autonomous root cause analysis
- Full-stack observability
- Dependency mapping
- AI-driven anomaly detection
- Application performance analysis
- Infrastructure intelligence
- Enterprise operational visibility
AI-Specific Depth
- Model support: Proprietary hosted AI models
- RAG / knowledge integration: Topology and telemetry context
- Evaluation: Root cause validation workflows
- Guardrails: Enterprise governance and RBAC
- Observability: Full-stack operational visibility
Pros
- Excellent enterprise observability
- Strong autonomous analysis
- Deep infrastructure visibility
Cons
- Enterprise complexity may be high
- Learning curve for smaller teams
- Premium pricing environment
Security & Compliance
Enterprise-grade governance, SSO, RBAC, encryption, and auditability vary by deployment.
Deployment & Platforms
- Cloud
- Hybrid
- Enterprise infrastructure environments
Integrations & Ecosystem
Dynatrace integrates deeply into enterprise observability ecosystems.
- Kubernetes
- Cloud platforms
- Application monitoring
- Infrastructure monitoring
- Logs
- Traces
- AI Ops workflows
Pricing Model
Enterprise subscription pricing varies.
Best-Fit Scenarios
- Enterprise observability
- Autonomous troubleshooting
- Large-scale infrastructure operations
#3 — New Relic Grok
One-line verdict: Best for conversational observability workflows and AI-assisted operational investigation.
Short description:
New Relic Grok helps engineers investigate infrastructure and application issues conversationally using telemetry-driven AI workflows.
Standout Capabilities
- Conversational observability
- AI-powered troubleshooting
- Log and telemetry analysis
- Operational summarization
- Incident investigation workflows
- Infrastructure insights
- Full-stack monitoring support
AI-Specific Depth
- Model support: Hosted AI workflows
- RAG / knowledge integration: Telemetry and operational metadata
- Evaluation: Investigation and remediation workflows
- Guardrails: Governance and access controls
- Observability: Full-stack visibility
Pros
- Strong conversational UX
- Good observability integration
- Useful operational summaries
Cons
- Best within New Relic ecosystems
- Advanced automation varies
- Enterprise customization may require tuning
Security & Compliance
Security and governance features vary by deployment and enterprise plan.
Deployment & Platforms
- Cloud-hosted
- Web
- Observability workflows
Integrations & Ecosystem
New Relic Grok integrates into cloud-native monitoring environments.
- Kubernetes
- Logs
- Metrics
- Traces
- Cloud providers
- DevOps workflows
Pricing Model
Usage-based and enterprise pricing varies.
Best-Fit Scenarios
- Conversational troubleshooting
- Application monitoring
- SRE observability workflows
#4 — Splunk AI Assistant
One-line verdict: Best for operational analytics and AI-assisted troubleshooting across large enterprise environments.
Short description:
Splunk AI Assistant helps SRE and operations teams analyze logs, investigate incidents, accelerate troubleshooting, and improve operational intelligence workflows.
Standout Capabilities
- AI-assisted operational analytics
- Log investigation workflows
- Search acceleration
- Incident analysis support
- Security and observability integration
- Enterprise operational visibility
- Analytics-driven troubleshooting
AI-Specific Depth
- Model support: Hosted AI workflows
- RAG / knowledge integration: Operational and telemetry data
- Evaluation: Investigation and review workflows
- Guardrails: Enterprise governance and RBAC
- Observability: Deep operational analytics visibility
Pros
- Excellent operational analytics
- Strong enterprise scalability
- Useful investigation workflows
Cons
- Operational complexity may be high
- Learning curve varies
- Splunk ecosystem dependency
Security & Compliance
Enterprise-grade governance, auditability, RBAC, and permissions vary by deployment.
Deployment & Platforms
- Cloud
- Hybrid
- Enterprise operational environments
Integrations & Ecosystem
Splunk AI Assistant fits large-scale operational analytics workflows.
- Logs
- SIEM systems
- Infrastructure telemetry
- Kubernetes
- Cloud monitoring
- Security operations
Pricing Model
Enterprise pricing varies significantly.
Best-Fit Scenarios
- Enterprise troubleshooting
- Operational analytics
- Security and observability convergence
#5 — PagerDuty Operations Cloud
One-line verdict: Best for AI-assisted incident response and operational coordination workflows.
Short description:
PagerDuty Operations Cloud combines incident response, alert management, operational automation, and AI-assisted troubleshooting workflows for SRE organizations.
Standout Capabilities
- AI incident summarization
- Alert prioritization
- Runbook automation
- Incident coordination workflows
- Escalation management
- Operational automation
- Multi-cloud operational visibility
AI-Specific Depth
- Model support: Hosted AI workflows
- RAG / knowledge integration: Incident history and operational metadata
- Evaluation: Incident review workflows
- Guardrails: Enterprise governance controls
- Observability: Incident and operational visibility
Pros
- Strong incident management
- Mature operational workflows
- Excellent ecosystem integrations
Cons
- Premium enterprise orientation
- Complex deployments for smaller teams
- Automation requires governance maturity
Security & Compliance
SSO, RBAC, governance, and auditability features vary by deployment and subscription plan.
Deployment & Platforms
- Cloud-hosted
- Web
- Mobile
- Slack and Teams integrations
Integrations & Ecosystem
PagerDuty integrates deeply into modern operational ecosystems.
- Kubernetes
- Datadog
- AWS
- Azure
- Jira
- Slack
- Observability systems
Pricing Model
Tiered enterprise pricing varies.
Best-Fit Scenarios
- Incident coordination
- Operational response automation
- SRE escalation management
#6 — Elastic AI Assistant
One-line verdict: Best for AI-assisted Elasticsearch troubleshooting and observability workflows.
Short description:
Elastic AI Assistant enhances operational analysis and troubleshooting workflows across logs, metrics, traces, and security telemetry within Elastic environments.
Standout Capabilities
- AI operational analysis
- Log and telemetry summarization
- Search acceleration
- Security and observability integration
- Elasticsearch-native workflows
- Operational visibility
- AI-assisted troubleshooting
AI-Specific Depth
- Model support: Hosted AI integrations
- RAG / knowledge integration: Elasticsearch telemetry and metadata
- Evaluation: Operational review workflows
- Guardrails: Governance and RBAC controls
- Observability: Full-stack observability support
Pros
- Strong search and analytics workflows
- Useful telemetry analysis
- Good Elastic ecosystem integration
Cons
- Elastic ecosystem focus
- Enterprise complexity varies
- AI workflow maturity evolving
Security & Compliance
Enterprise governance and operational permissions vary by deployment.
Deployment & Platforms
- Cloud
- Hybrid
- Elasticsearch workflows
Integrations & Ecosystem
Elastic AI Assistant integrates into observability and security operations.
- Logs
- Metrics
- Security telemetry
- Kubernetes
- Cloud providers
- Search analytics
Pricing Model
Subscription pricing varies.
Best-Fit Scenarios
- Elasticsearch troubleshooting
- Log analytics
- Security and observability workflows
#7 — Grafana Assistant
One-line verdict: Best for open observability ecosystems and AI-assisted dashboard troubleshooting workflows.
Short description:
Grafana Assistant helps engineering teams investigate metrics, dashboards, alerts, and observability workflows conversationally across Grafana environments.
Standout Capabilities
- Dashboard intelligence
- Metrics troubleshooting
- Conversational observability
- Multi-source telemetry workflows
- Alert analysis
- Open observability support
- Visualization-driven operations
AI-Specific Depth
- Model support: Hosted AI workflows vary
- RAG / knowledge integration: Metrics and dashboard metadata
- Evaluation: Operational investigation workflows
- Guardrails: Governance varies
- Observability: Multi-source operational visibility
Pros
- Strong open observability support
- Flexible integrations
- Good metrics workflows
Cons
- AI depth still evolving
- Enterprise governance varies
- Complex environments require tuning
Security & Compliance
Security, RBAC, and governance vary depending on deployment.
Deployment & Platforms
- Cloud
- Self-hosted
- Hybrid observability environments
Integrations & Ecosystem
Grafana Assistant fits modern observability ecosystems.
- Prometheus
- Loki
- Tempo
- Kubernetes
- Cloud monitoring
- OpenTelemetry
Pricing Model
Open-source and enterprise offerings vary.
Best-Fit Scenarios
- Open observability
- Metrics troubleshooting
- Dashboard operations
#8 — Moogsoft AI Ops
One-line verdict: Best for enterprise AI Ops and large-scale operational event correlation workflows.
Short description:
Moogsoft AI Ops helps organizations correlate events, reduce operational noise, automate incident analysis, and improve enterprise reliability workflows.
Standout Capabilities
- Event correlation
- AI-driven noise reduction
- Incident prioritization
- Operational analytics
- AI Ops automation
- Root cause workflows
- Enterprise event intelligence
AI-Specific Depth
- Model support: Proprietary AI workflows
- RAG / knowledge integration: Operational telemetry and event metadata
- Evaluation: Event analysis workflows
- Guardrails: Enterprise governance support
- Observability: Event and operational visibility
Pros
- Strong event correlation
- Useful noise reduction
- Enterprise AI Ops workflows
Cons
- Enterprise complexity
- Setup and tuning effort
- Premium operational environments
Security & Compliance
Enterprise-grade governance, RBAC, and operational controls vary by deployment.
Deployment & Platforms
- Cloud
- Hybrid
- Enterprise AI Ops environments
Integrations & Ecosystem
Moogsoft integrates into enterprise operational ecosystems.
- Monitoring systems
- Logs
- Metrics
- ITSM systems
- Cloud platforms
- Incident workflows
Pricing Model
Enterprise pricing varies.
Best-Fit Scenarios
- AI Ops operations
- Event correlation
- Enterprise incident reduction
#9 — BigPanda AI Ops
One-line verdict: Best for alert correlation and operational incident intelligence at enterprise scale.
Short description:
BigPanda AI Ops helps organizations correlate alerts, prioritize incidents, and accelerate troubleshooting workflows across distributed infrastructure environments.
Standout Capabilities
- Alert correlation
- Operational intelligence
- Incident prioritization
- AI Ops workflows
- Noise reduction
- Root cause analysis support
- Enterprise operational visibility
AI-Specific Depth
- Model support: Proprietary hosted AI workflows
- RAG / knowledge integration: Alert and telemetry metadata
- Evaluation: Incident analysis workflows
- Guardrails: Governance and operational controls
- Observability: Infrastructure and operational visibility
Pros
- Excellent alert correlation
- Strong operational prioritization
- Enterprise-scale workflows
Cons
- Enterprise orientation
- Setup complexity varies
- Premium pricing environment
Security & Compliance
Enterprise governance, RBAC, and permissions vary by deployment.
Deployment & Platforms
- Cloud-hosted
- Enterprise operational workflows
Integrations & Ecosystem
BigPanda integrates into enterprise monitoring ecosystems.
- Monitoring tools
- Cloud providers
- Incident systems
- ITSM workflows
- Infrastructure telemetry
- AI Ops pipelines
Pricing Model
Enterprise subscription pricing varies.
Best-Fit Scenarios
- Alert correlation
- Operational prioritization
- Enterprise AI Ops
#10 — Microsoft Copilot for Azure
One-line verdict: Best for Azure-native infrastructure troubleshooting and AI-assisted cloud operations.
Short description:
Microsoft Copilot for Azure helps operations teams troubleshoot cloud resources, investigate incidents, analyze infrastructure, and automate Azure operational workflows.
Standout Capabilities
- Azure operational analysis
- AI-assisted cloud troubleshooting
- Infrastructure guidance
- Cloud optimization support
- Operational summarization
- Governance integration
- Security and infrastructure visibility
AI-Specific Depth
- Model support: Hosted Microsoft AI models
- RAG / knowledge integration: Azure infrastructure metadata
- Evaluation: Operational review workflows
- Guardrails: Enterprise RBAC and governance
- Observability: Azure operational visibility
Pros
- Strong Azure integration
- Useful cloud troubleshooting workflows
- Enterprise governance support
Cons
- Azure-centric ecosystem
- Multi-cloud flexibility varies
- Enterprise complexity may increase
Security & Compliance
Enterprise-grade Microsoft governance, RBAC, auditability, and permissions vary by deployment.
Deployment & Platforms
- Azure cloud
- Web
- Microsoft operational workflows
Integrations & Ecosystem
Microsoft Copilot for Azure integrates deeply into Azure operational environments.
- Azure Monitor
- Azure Kubernetes Service
- Microsoft Defender
- Teams
- GitHub
- Cloud operations
Pricing Model
Usage and enterprise pricing vary.
Best-Fit Scenarios
- Azure troubleshooting
- Enterprise cloud operations
- AI-assisted infrastructure analysis
Comparison Table
| Tool Name | Best For | Deployment | Model Flexibility | Strength | Watch-Out | Public Rating |
|---|---|---|---|---|---|---|
| Datadog Bits AI | Cloud-native troubleshooting | Cloud | Hosted | Deep observability | Datadog ecosystem focus | N/A |
| Dynatrace Davis AI | Enterprise root cause analysis | Hybrid | Proprietary | Autonomous analysis | Enterprise complexity | N/A |
| New Relic Grok | Conversational observability | Cloud | Hosted | AI UX | Ecosystem dependency | N/A |
| Splunk AI Assistant | Operational analytics | Hybrid | Hosted | Enterprise search | Learning curve | N/A |
| PagerDuty Operations Cloud | Incident operations | Cloud | Hosted | Incident automation | Premium workflows | N/A |
| Elastic AI Assistant | Elasticsearch troubleshooting | Hybrid | Hosted | Search analytics | Elastic-centric workflows | N/A |
| Grafana Assistant | Open observability | Hybrid | Varies | Open ecosystem | AI maturity evolving | N/A |
| Moogsoft AI Ops | Enterprise AI Ops | Hybrid | Proprietary | Event correlation | Setup complexity | N/A |
| BigPanda AI Ops | Alert prioritization | Cloud | Proprietary | Noise reduction | Enterprise focus | N/A |
| Microsoft Copilot for Azure | Azure troubleshooting | Cloud | Hosted | Azure integration | Azure-centric workflows | N/A |
Scoring & Evaluation
The following scores are comparative rather than absolute rankings. Each platform was evaluated based on root cause analysis quality, observability depth, AI troubleshooting capabilities, operational governance, cloud-native compatibility, alert reduction effectiveness, usability, and scalability. The best platform depends on whether your organization prioritizes observability, AI Ops, incident management, or cloud-native troubleshooting.
| Tool | Core | Reliability/Eval | Guardrails | Integrations | Ease | Perf/Cost | Security/Admin | Support | Weighted Total |
|---|---|---|---|---|---|---|---|---|---|
| Datadog Bits AI | 9.2 | 8.8 | 8.5 | 9.2 | 8.4 | 7.8 | 8.5 | 8.7 | 8.8 |
| Dynatrace Davis AI | 9.4 | 9.2 | 8.8 | 8.8 | 7.8 | 7.2 | 9.0 | 8.8 | 8.8 |
| New Relic Grok | 8.8 | 8.5 | 8.0 | 8.5 | 8.8 | 8.0 | 8.2 | 8.4 | 8.5 |
| Splunk AI Assistant | 9.0 | 8.8 | 8.8 | 8.5 | 7.5 | 7.2 | 9.0 | 8.8 | 8.5 |
| PagerDuty Operations Cloud | 8.8 | 8.5 | 8.7 | 9.0 | 8.2 | 7.5 | 8.8 | 8.7 | 8.5 |
| Elastic AI Assistant | 8.5 | 8.2 | 8.0 | 8.5 | 8.0 | 8.2 | 8.2 | 8.0 | 8.3 |
| Grafana Assistant | 8.4 | 8.0 | 7.8 | 8.8 | 8.5 | 8.5 | 7.8 | 8.0 | 8.3 |
| Moogsoft AI Ops | 8.8 | 8.7 | 8.5 | 8.4 | 7.5 | 7.0 | 8.8 | 8.5 | 8.4 |
| BigPanda AI Ops | 8.7 | 8.5 | 8.5 | 8.4 | 7.8 | 7.5 | 8.7 | 8.5 | 8.4 |
| Microsoft Copilot for Azure | 8.8 | 8.4 | 8.8 | 8.5 | 8.2 | 7.8 | 9.0 | 8.5 | 8.5 |
Top 3 for Enterprise
1- Dynatrace Davis AI
2- Datadog Bits AI
3- Splunk AI Assistant
Top 3 for SMB
1- New Relic Grok
2- Grafana Assistant
3- PagerDuty Operations Cloud
Top 3 for Developers
1- Grafana Assistant
2- Datadog Bits AI
3- New Relic Grok
Which AI SRE Troubleshooting Assistant Is Right for You
Solo / Freelancer
Small engineering teams benefit most from lightweight observability and conversational troubleshooting workflows. Grafana Assistant and New Relic Grok are practical because they reduce operational complexity while remaining approachable.
SMB
SMBs should prioritize operational visibility, alert reduction, observability integration, and automation workflows. Datadog Bits AI, PagerDuty Operations Cloud, and New Relic Grok provide strong balance between usability and operational power.
Mid-Market
Mid-market organizations should focus on governance, operational automation, AI-assisted analysis, and incident coordination. Dynatrace Davis AI, Datadog Bits AI, and Splunk AI Assistant are especially valuable for scaling operational maturity.
Enterprise
Enterprises should prioritize auditability, RBAC, operational governance, AI Ops workflows, multi-cloud compatibility, and deep observability integration. Dynatrace Davis AI, Splunk AI Assistant, and BigPanda AI Ops are strong enterprise-ready options.
Regulated Industries
Finance, healthcare, insurance, and public sector organizations should validate governance, operational approvals, RBAC, audit logging, and AI-generated remediation workflows carefully before broad operational adoption.
Budget vs Premium
Budget-focused teams can start with Grafana Assistant or observability tooling already present in their ecosystems. Premium enterprise AI Ops platforms become valuable when organizations require advanced root cause analysis, governance, and large-scale operational automation.
Build vs Buy
Organizations with advanced SRE maturity can build custom troubleshooting assistants using observability APIs and AI frameworks. Most organizations benefit from buying because telemetry correlation, operational governance, incident workflows, and observability integration are difficult to maintain internally.
Implementation Playbook 30 / 60 / 90 Days
First 30 Days
- Identify high-noise operational workflows
- Select pilot incident investigation scenarios
- Integrate observability telemetry sources
- Define governance and operational permissions
- Test AI-generated summaries carefully
- Establish approval workflows
- Validate Kubernetes and cloud integrations
- Create incident review standards
Days 30–60
- Expand automation into operational workflows
- Add deployment impact analysis
- Improve alert prioritization rules
- Train SRE and DevOps teams
- Integrate ChatOps workflows
- Add operational audit controls
- Optimize telemetry correlation
- Standardize troubleshooting procedures
Days 60–90
- Scale AI-assisted troubleshooting organization-wide
- Add advanced remediation workflows
- Expand operational analytics
- Improve governance and auditability
- Optimize observability integrations
- Review incident reduction metrics
- Standardize operational AI policies
- Build long-term reliability workflows
Common Mistakes & How to Avoid Them
- Trusting AI-generated remediation blindly
- Ignoring operational governance requirements
- Over-automating production troubleshooting
- Failing to validate root cause analysis
- Ignoring alert quality and telemetry hygiene
- Using incomplete observability data
- Granting excessive operational permissions
- Neglecting incident review workflows
- Ignoring deployment context during troubleshooting
- Creating AI Ops vendor lock-in
- Not training engineers on AI-assisted workflows
- Failing to validate telemetry integrations
- Ignoring operational auditability
- Using AI without clear escalation standards
FAQs
1. What are AI SRE Troubleshooting Assistants?
These platforms help SRE and DevOps teams investigate incidents, correlate telemetry, summarize operational issues, and accelerate root cause analysis using AI.
2. Can AI identify root causes automatically?
Some platforms can suggest highly likely root causes based on telemetry correlation, but engineers should still validate findings carefully.
3. Which tool is best for Kubernetes troubleshooting?
Datadog Bits AI, Grafana Assistant, and Dynatrace Davis AI are particularly strong for Kubernetes operational workflows.
4. Are these tools replacing SRE engineers?
No. They reduce repetitive operational work but still require human oversight, engineering expertise, and operational judgment.
5. Can these tools reduce alert fatigue?
Yes. Many platforms correlate alerts, suppress noise, and prioritize incidents to improve operational focus.
6. Which platform is best for enterprise AI Ops?
Dynatrace Davis AI, Moogsoft AI Ops, and BigPanda AI Ops are strong enterprise-focused options.
7. Are these tools secure enough for production environments?
Enterprise-grade platforms often support RBAC, SSO, audit logging, governance controls, and operational permissions, but organizations should validate configurations carefully.
8. What is the biggest risk?
The biggest risk is over-trusting AI-generated remediation or root cause analysis without sufficient operational review.
9. Can these tools integrate into existing observability stacks?
Yes. Most platforms integrate with logs, metrics, traces, monitoring systems, Kubernetes environments, and cloud providers.
10. Are AI troubleshooting assistants useful for startups?
Yes. Startups benefit significantly because these platforms reduce operational burden and improve troubleshooting efficiency with smaller teams.
11. How important is observability maturity?
Observability quality is critical because AI troubleshooting depends heavily on accurate telemetry, logs, traces, and metadata.
12. How should organizations begin adoption?
Start with incident summarization and low-risk troubleshooting workflows, validate AI outputs carefully, establish governance standards, and expand gradually.
Conclusion
AI SRE Troubleshooting Assistants are becoming essential operational tools for organizations managing modern cloud-native infrastructure and distributed systems. As observability environments become more complex and deployment velocity increases, SRE teams increasingly need systems that can correlate telemetry, summarize incidents, reduce alert fatigue, and accelerate operational investigations automatically. Modern AI-powered troubleshooting platforms improve reliability workflows while helping engineers spend less time manually navigating fragmented operational tooling.Datadog Bits AI and Dynatrace Davis AI are particularly strong for enterprise-grade observability and root cause analysis, while New Relic Grok and Grafana Assistant provide useful conversational troubleshooting workflows. Splunk AI Assistant remains valuable for operational analytics, and Moogsoft AI Ops plus BigPanda AI Ops excel in enterprise event correlation and alert prioritization.The best platform depends on your observability maturity, infrastructure complexity, governance requirements, and operational automation goals. Start by identifying repetitive troubleshooting workflows, validate AI-generated insights carefully, establish operational approval processes, and gradually scale AI-assisted troubleshooting as your organization builds confidence and operational maturity.
Find Trusted Cardiac Hospitals
Compare heart hospitals by city and services — all in one place.
Explore Hospitals
A well-explained comparison that shows how AI-powered SRE troubleshooting assistants can help teams reduce downtime and speed up incident resolution more effectively.