Introduction
AI Observability Copilots help engineering, DevOps, SRE, platform, and AI infrastructure teams monitor, investigate, analyze, and optimize complex systems using conversational AI, automated telemetry correlation, anomaly detection, root cause analysis, and operational intelligence. These platforms combine logs, metrics, traces, events, deployment metadata, infrastructure topology, and AI-assisted workflows into unified operational experiences.
Modern distributed systems are increasingly difficult to troubleshoot manually because organizations operate Kubernetes clusters, serverless workloads, AI pipelines, APIs, microservices, multi-cloud infrastructure, and AI agents simultaneously. Traditional dashboards alone are no longer enough. AI Observability Copilots reduce operational noise and accelerate troubleshooting by surfacing likely causes, summarizing incidents, correlating telemetry automatically, and assisting engineers conversationally.
Why It Matters
Organizations now generate enormous amounts of telemetry data across logs, metrics, traces, AI inference pipelines, and infrastructure events. Engineers increasingly spend more time navigating dashboards and troubleshooting tooling than actually resolving problems. AI Observability Copilots help reduce cognitive overload by turning operational data into actionable intelligence.
These tools are especially valuable for cloud-native organizations, SaaS companies, platform engineering teams, AI infrastructure operators, DevOps teams, SRE groups, and enterprises managing large-scale distributed systems. Modern observability copilots increasingly support conversational troubleshooting, deployment analysis, AI Ops automation, telemetry cost optimization, Kubernetes operations, OpenTelemetry-native workflows, and AI workload visibility.
Real World Use Cases
- AI-assisted root cause analysis
- Kubernetes troubleshooting workflows
- Incident summarization and response
- Multi-cloud observability operations
- Deployment impact analysis
- Alert prioritization and noise reduction
- AI application monitoring
- OpenTelemetry-based observability
- Infrastructure dependency analysis
- Conversational troubleshooting workflows
Evaluation Criteria for Buyers
When evaluating AI Observability Copilots, buyers should consider:
- Telemetry correlation quality
- AI-assisted troubleshooting accuracy
- OpenTelemetry compatibility
- Logs, metrics, and traces integration
- Kubernetes and cloud-native support
- Conversational investigation workflows
- Alert noise reduction capabilities
- AI Ops automation support
- Governance and RBAC controls
- Cost optimization and telemetry governance
- Multi-cloud compatibility
- AI workload observability support
Best for: SRE teams, platform engineering groups, DevOps organizations, cloud-native infrastructure teams, AI infrastructure operators, SaaS providers, enterprise operations teams, and organizations managing distributed systems at scale.
Not ideal for: organizations with minimal observability maturity, very small infrastructure footprints, or teams unwilling to invest in telemetry hygiene and operational governance.
What’s Changed in AI Observability Copilots
- Conversational observability workflows are becoming mainstream.
- AI-powered incident summarization is significantly improving.
- OpenTelemetry is becoming the default observability standard.
- AI agent observability is emerging rapidly across platforms.
- Telemetry cost governance is becoming a major buyer concern.
- AI copilots increasingly combine metrics, logs, traces, and topology automatically.
- Kubernetes troubleshooting automation is becoming more advanced.
- AI-assisted remediation guidance is becoming more context-aware.
- Observability vendors are embedding AI deeply into operational workflows.
- AI Ops and observability platforms are increasingly converging.
- Infrastructure dependency mapping is becoming more autonomous.
- Organizations increasingly expect explainable AI-driven troubleshooting.
Quick Buyer Checklist
- Does the platform correlate logs, metrics, traces, and events automatically?
- Is OpenTelemetry supported natively?
- Can the copilot summarize incidents conversationally?
- Does it support Kubernetes troubleshooting?
- Can it analyze deployment impact automatically?
- Does it reduce alert fatigue effectively?
- Are AI workload observability features included?
- Can telemetry costs be optimized and governed?
- Are RBAC and governance controls available?
- Does it support multi-cloud environments?
- Can engineers customize operational workflows safely?
- Is observability data exportable and portable?
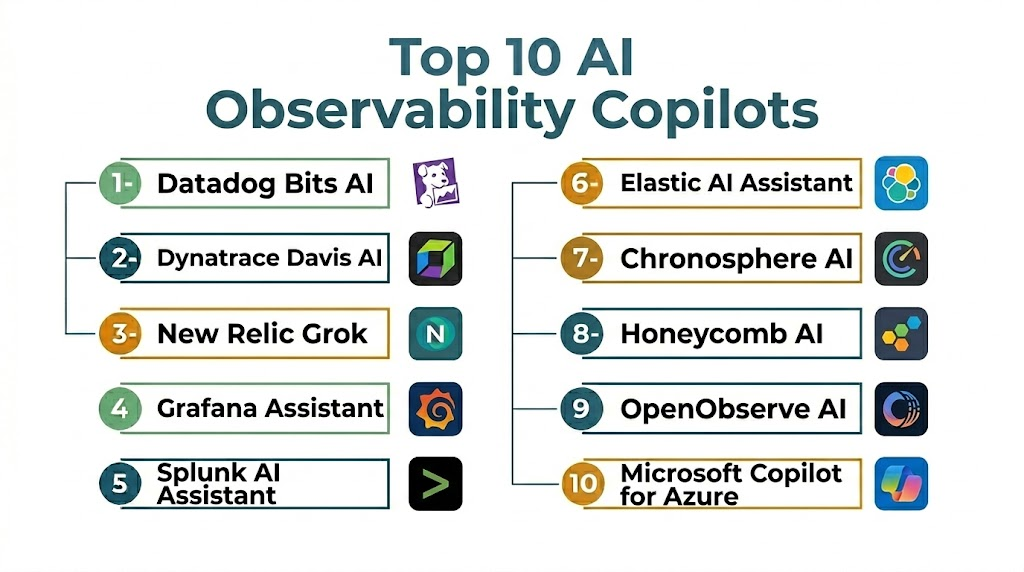
Top 10 AI Observability Copilots
1- Datadog Bits AI
2- Dynatrace Davis AI
3- New Relic Grok
4- Grafana Assistant
5- Splunk AI Assistant
6- Elastic AI Assistant
7- Chronosphere AI
8- Honeycomb AI
9- OpenObserve AI
10- Microsoft Copilot for Azure
#1 — Datadog Bits AI
One-line verdict: Best overall for AI-powered cloud-native observability and operational troubleshooting workflows.
Short description:
Datadog Bits AI helps SRE and DevOps teams investigate incidents, analyze telemetry, summarize alerts, and troubleshoot distributed systems using AI-assisted observability workflows.
Standout Capabilities
- AI-powered observability analysis
- Logs, metrics, and traces correlation
- Incident summarization
- Kubernetes operational workflows
- AI-assisted troubleshooting
- Cloud-native infrastructure visibility
- Telemetry intelligence and automation
AI-Specific Depth
- Model support: Hosted AI workflows
- RAG / knowledge integration: Infrastructure and telemetry metadata
- Evaluation: Incident and operational investigation workflows
- Guardrails: Enterprise RBAC and governance support
- Observability: Full-stack telemetry visibility
Pros
- Excellent observability depth
- Strong cloud-native workflows
- Mature operational ecosystem
Cons
- Enterprise pricing can become expensive
- Datadog ecosystem dependency
- Telemetry cost management required at scale
Security & Compliance
Enterprise governance, RBAC, SSO, auditability, and operational permissions vary by deployment and subscription plan.
Deployment & Platforms
- Cloud-hosted
- Web-based
- Kubernetes support
- Slack integrations
- Multi-cloud workflows
Integrations & Ecosystem
Datadog integrates deeply into modern observability and AI Ops ecosystems.
- Kubernetes
- AWS
- Azure
- GCP
- OpenTelemetry
- CI/CD systems
- Incident workflows
Pricing Model
Usage and enterprise pricing vary significantly.
Best-Fit Scenarios
- Cloud-native observability
- AI-assisted troubleshooting
- Enterprise SRE workflows
#2 — Dynatrace Davis AI
One-line verdict: Best for enterprise autonomous observability and AI-driven root cause analysis.
Short description:
Dynatrace Davis AI automates root cause analysis, operational intelligence, dependency mapping, and observability workflows across complex enterprise infrastructure environments.
Standout Capabilities
- Autonomous root cause analysis
- Full-stack observability
- Infrastructure dependency mapping
- AI-driven anomaly detection
- Enterprise operational intelligence
- Application and infrastructure monitoring
- Automated topology analysis
AI-Specific Depth
- Model support: Proprietary hosted AI models
- RAG / knowledge integration: Infrastructure topology and telemetry
- Evaluation: Root cause validation workflows
- Guardrails: Enterprise governance and RBAC
- Observability: Full-stack operational visibility
Pros
- Excellent enterprise automation
- Strong AI-driven analysis
- Deep infrastructure visibility
Cons
- Enterprise complexity can be high
- Premium pricing environment
- Learning curve for smaller teams
Security & Compliance
Enterprise-grade RBAC, SSO, auditability, governance, and operational controls vary by deployment.
Deployment & Platforms
- Cloud
- Hybrid
- Enterprise infrastructure environments
Integrations & Ecosystem
Dynatrace integrates deeply into enterprise operational environments.
- Kubernetes
- Cloud providers
- OpenTelemetry
- Application monitoring
- Infrastructure telemetry
- AI Ops workflows
Pricing Model
Enterprise subscription pricing varies.
Best-Fit Scenarios
- Enterprise observability
- Autonomous troubleshooting
- Large-scale infrastructure operations
#3 — New Relic Grok
One-line verdict: Best for conversational observability and developer-friendly operational investigation workflows.
Short description:
New Relic Grok helps engineers investigate telemetry, troubleshoot systems, summarize incidents, and interact conversationally with observability data.
Standout Capabilities
- Conversational observability workflows
- AI operational summaries
- Telemetry analysis
- Incident investigation assistance
- Infrastructure troubleshooting
- Full-stack visibility
- Cloud-native monitoring support
AI-Specific Depth
- Model support: Hosted AI workflows
- RAG / knowledge integration: Observability telemetry and metadata
- Evaluation: Operational review workflows
- Guardrails: Governance and permissions support
- Observability: Metrics, logs, traces, and infrastructure visibility
Pros
- Strong conversational UX
- Good developer experience
- Useful troubleshooting workflows
Cons
- Ecosystem dependency varies
- Enterprise customization may require tuning
- Advanced automation varies
Security & Compliance
Security and governance controls vary by enterprise deployment and plan.
Deployment & Platforms
- Cloud-hosted
- Web
- Kubernetes support
- Multi-cloud monitoring
Integrations & Ecosystem
New Relic integrates into modern observability and DevOps environments.
- Kubernetes
- Logs
- Metrics
- Traces
- Cloud providers
- OpenTelemetry
Pricing Model
Usage-based and enterprise pricing varies.
Best-Fit Scenarios
- Conversational troubleshooting
- Developer observability
- Cloud-native monitoring
#4 — Grafana Assistant
One-line verdict: Best for open observability ecosystems and OpenTelemetry-native operational workflows.
Short description:
Grafana Assistant helps engineering teams investigate dashboards, metrics, alerts, and telemetry conversationally across open observability environments.
Standout Capabilities
- Open observability workflows
- Conversational telemetry analysis
- Dashboard intelligence
- Metrics troubleshooting
- OpenTelemetry support
- Flexible integrations
- Telemetry cost optimization support
AI-Specific Depth
- Model support: Hosted AI workflows vary
- RAG / knowledge integration: Metrics and dashboard metadata
- Evaluation: Operational investigation workflows
- Guardrails: Governance varies by deployment
- Observability: Multi-source telemetry visibility
Pros
- Excellent open ecosystem flexibility
- Strong OpenTelemetry support
- Good multi-source observability workflows
Cons
- AI maturity still evolving
- Enterprise governance varies
- Advanced automation depends on stack maturity
Security & Compliance
Security, governance, RBAC, and auditability vary by deployment.
Deployment & Platforms
- Cloud
- Self-hosted
- Hybrid observability workflows
Integrations & Ecosystem
Grafana integrates deeply into open observability environments.
- Prometheus
- Loki
- Tempo
- Kubernetes
- OpenTelemetry
- Cloud monitoring
Pricing Model
Open-source and enterprise pricing vary.
Best-Fit Scenarios
- OpenTelemetry observability
- Open-source observability stacks
- Kubernetes monitoring
#5 — Splunk AI Assistant
One-line verdict: Best for operational analytics and enterprise observability intelligence workflows.
Short description:
Splunk AI Assistant helps organizations investigate operational telemetry, analyze incidents, accelerate troubleshooting, and improve observability analytics.
Standout Capabilities
- AI-assisted operational analytics
- Search acceleration workflows
- Incident investigation support
- Security and observability convergence
- Enterprise telemetry analysis
- AI Ops workflows
- Large-scale operational visibility
AI-Specific Depth
- Model support: Hosted AI workflows
- RAG / knowledge integration: Telemetry and operational metadata
- Evaluation: Investigation and review workflows
- Guardrails: Enterprise governance and RBAC
- Observability: Large-scale operational analytics visibility
Pros
- Excellent enterprise analytics
- Strong observability depth
- Good AI Ops workflows
Cons
- Complexity can be high
- Learning curve varies
- Splunk ecosystem focus
Security & Compliance
Enterprise governance, auditability, RBAC, and permissions vary by deployment.
Deployment & Platforms
- Cloud
- Hybrid
- Enterprise operational environments
Integrations & Ecosystem
Splunk integrates into enterprise observability and security workflows.
- Logs
- SIEM systems
- Kubernetes
- Cloud telemetry
- Infrastructure monitoring
- AI Ops workflows
Pricing Model
Enterprise pricing varies significantly.
Best-Fit Scenarios
- Enterprise analytics
- Security and observability convergence
- Large-scale troubleshooting
#6 — Elastic AI Assistant
One-line verdict: Best for Elasticsearch-native AI troubleshooting and telemetry analysis workflows.
Short description:
Elastic AI Assistant enhances operational troubleshooting and observability workflows across logs, metrics, traces, and security telemetry inside Elastic environments.
Standout Capabilities
- AI-powered telemetry analysis
- Elasticsearch-native workflows
- Search-driven troubleshooting
- Security and observability integration
- Operational summarization
- Full-stack observability support
- AI-assisted analytics
AI-Specific Depth
- Model support: Hosted AI integrations
- RAG / knowledge integration: Elasticsearch telemetry and metadata
- Evaluation: Operational analysis workflows
- Guardrails: Governance and RBAC controls
- Observability: Logs, metrics, traces, and security telemetry
Pros
- Strong search and analytics
- Good telemetry workflows
- Useful security integration
Cons
- Elastic ecosystem focus
- AI maturity evolving
- Enterprise setup complexity varies
Security & Compliance
Enterprise governance, RBAC, and auditability vary by deployment.
Deployment & Platforms
- Cloud
- Hybrid
- Elasticsearch environments
Integrations & Ecosystem
Elastic integrates into observability and security operations environments.
- Elasticsearch
- Kubernetes
- OpenTelemetry
- Security telemetry
- Cloud providers
- Log analytics
Pricing Model
Subscription pricing varies.
Best-Fit Scenarios
- Elasticsearch operations
- AI-assisted telemetry analysis
- Security and observability workflows
#7 — Chronosphere AI
One-line verdict: Best for cloud-native metrics observability and telemetry cost optimization workflows.
Short description:
Chronosphere helps organizations manage observability scale, optimize telemetry costs, and troubleshoot distributed systems with AI-assisted operational workflows.
Standout Capabilities
- Metrics observability optimization
- Telemetry cost governance
- Cloud-native observability
- OpenTelemetry-native workflows
- AI-assisted troubleshooting
- Kubernetes observability
- Large-scale telemetry management
AI-Specific Depth
- Model support: Hosted AI workflows vary
- RAG / knowledge integration: Telemetry metadata and infrastructure context
- Evaluation: Operational analytics workflows
- Guardrails: Governance and operational controls
- Observability: Metrics and cloud-native telemetry visibility
Pros
- Strong telemetry governance
- Good cloud-native scalability
- Useful observability cost optimization
Cons
- Metrics-centric orientation
- AI depth still evolving
- Smaller ecosystem compared to major vendors
Security & Compliance
Enterprise governance and operational permissions vary by deployment.
Deployment & Platforms
- Cloud-hosted
- Kubernetes support
- OpenTelemetry-native workflows
Integrations & Ecosystem
Chronosphere integrates into cloud-native observability ecosystems.
- Kubernetes
- Prometheus
- OpenTelemetry
- Cloud monitoring
- Metrics pipelines
- Infrastructure telemetry
Pricing Model
Enterprise subscription pricing varies.
Best-Fit Scenarios
- Metrics observability
- Telemetry governance
- Kubernetes operations
#8 — Honeycomb AI
One-line verdict: Best for deep distributed tracing and debugging complex microservices environments.
Short description:
Honeycomb AI helps engineering teams analyze distributed traces, investigate microservices behavior, and troubleshoot complex cloud-native systems.
Standout Capabilities
- Distributed tracing workflows
- Event-driven observability
- Deep microservices debugging
- OpenTelemetry-native support
- High-cardinality telemetry analysis
- Developer-focused troubleshooting
- AI-assisted trace analysis
AI-Specific Depth
- Model support: Hosted AI workflows
- RAG / knowledge integration: Distributed tracing metadata
- Evaluation: Trace analysis workflows
- Guardrails: Governance varies
- Observability: Event and trace visibility
Pros
- Excellent distributed tracing
- Strong debugging workflows
- OpenTelemetry-native design
Cons
- Trace-centric workflows dominate
- Enterprise governance varies
- Broader AI Ops capabilities evolving
Security & Compliance
Security and governance vary by deployment and subscription plan.
Deployment & Platforms
- Cloud-hosted
- OpenTelemetry-native workflows
- Distributed tracing environments
Integrations & Ecosystem
Honeycomb integrates into cloud-native observability stacks.
- OpenTelemetry
- Kubernetes
- Distributed tracing
- Cloud providers
- Microservices telemetry
- Developer workflows
Pricing Model
Usage-based pricing varies.
Best-Fit Scenarios
- Microservices troubleshooting
- Distributed tracing
- Developer debugging workflows
#9 — OpenObserve AI
One-line verdict: Best for cost-efficient open-source AI observability workflows and OpenTelemetry-native telemetry management.
Short description:
OpenObserve provides open-source observability workflows with AI-assisted analysis, OpenTelemetry-native ingestion, and telemetry management capabilities.
Standout Capabilities
- Open-source observability
- OpenTelemetry-native ingestion
- AI-assisted telemetry workflows
- Cost-efficient observability
- Metrics, logs, and traces support
- Cloud-native monitoring
- AI and LLM observability support
AI-Specific Depth
- Model support: Open-source and hosted workflows vary
- RAG / knowledge integration: Telemetry and infrastructure metadata
- Evaluation: Operational analysis workflows
- Guardrails: Governance varies by deployment
- Observability: Full telemetry visibility
Pros
- Cost-efficient architecture
- OpenTelemetry-native support
- Open-source flexibility
Cons
- Enterprise ecosystem smaller
- AI capabilities still maturing
- Advanced governance varies
Security & Compliance
Security and governance depend on deployment configuration.
Deployment & Platforms
- Cloud
- Self-hosted
- Hybrid
- Open-source observability environments
Integrations & Ecosystem
OpenObserve fits open observability and telemetry governance workflows.
- OpenTelemetry
- Kubernetes
- Logs
- Metrics
- Traces
- AI observability
Pricing Model
Open-source with commercial options varying.
Best-Fit Scenarios
- Open-source observability
- Cost optimization
- OpenTelemetry environments
#10 — Microsoft Copilot for Azure
One-line verdict: Best for Azure-native observability and AI-assisted cloud operations workflows.
Short description:
Microsoft Copilot for Azure helps teams investigate cloud infrastructure, analyze telemetry, troubleshoot Azure workloads, and automate operational workflows conversationally.
Standout Capabilities
- Azure-native operational analysis
- AI-assisted troubleshooting
- Infrastructure guidance workflows
- Cloud optimization support
- Operational summarization
- Governance integration
- Azure observability workflows
AI-Specific Depth
- Model support: Hosted Microsoft AI models
- RAG / knowledge integration: Azure infrastructure metadata
- Evaluation: Cloud operations workflows
- Guardrails: Enterprise RBAC and governance
- Observability: Azure telemetry visibility
Pros
- Strong Azure ecosystem integration
- Useful operational guidance
- Enterprise governance support
Cons
- Azure-centric workflows
- Multi-cloud flexibility varies
- Enterprise complexity may increase
Security & Compliance
Enterprise-grade governance, RBAC, permissions, and auditability vary by deployment.
Deployment & Platforms
- Azure cloud
- Web
- Microsoft operational workflows
Integrations & Ecosystem
Microsoft Copilot integrates deeply into Azure cloud operations.
- Azure Monitor
- Azure Kubernetes Service
- Microsoft Defender
- Teams
- GitHub
- Cloud telemetry
Pricing Model
Usage and enterprise pricing vary.
Best-Fit Scenarios
- Azure observability
- Enterprise cloud operations
- AI-assisted infrastructure troubleshooting
Comparison Table
| Tool Name | Best For | Deployment | Model Flexibility | Strength | Watch-Out | Public Rating |
|---|---|---|---|---|---|---|
| Datadog Bits AI | Cloud-native observability | Cloud | Hosted | Full-stack telemetry | Cost at scale | N/A |
| Dynatrace Davis AI | Enterprise AI observability | Hybrid | Proprietary | Autonomous analysis | Complexity | N/A |
| New Relic Grok | Conversational troubleshooting | Cloud | Hosted | Developer UX | Ecosystem focus | N/A |
| Grafana Assistant | Open observability | Hybrid | Varies | OpenTelemetry support | AI maturity evolving | N/A |
| Splunk AI Assistant | Operational analytics | Hybrid | Hosted | Enterprise analytics | Learning curve | N/A |
| Elastic AI Assistant | Elasticsearch workflows | Hybrid | Hosted | Search-driven troubleshooting | Elastic-centric | N/A |
| Chronosphere AI | Telemetry optimization | Cloud | Hosted | Cost governance | Metrics-centric focus | N/A |
| Honeycomb AI | Distributed tracing | Cloud | Hosted | Deep debugging | Trace-centric workflows | N/A |
| OpenObserve AI | Open-source observability | Hybrid | Open-source | Cost efficiency | Smaller ecosystem | N/A |
| Microsoft Copilot for Azure | Azure operations | Cloud | Hosted | Azure integration | Azure-centric workflows | N/A |
Scoring & Evaluation
The following scores are comparative rather than absolute rankings. Each platform was evaluated based on telemetry correlation, AI troubleshooting quality, OpenTelemetry support, governance, operational intelligence, cloud-native compatibility, usability, and scalability. The best platform depends on whether your organization prioritizes enterprise AI Ops, open observability, cloud-native troubleshooting, or telemetry governance.
| Tool | Core | Reliability/Eval | Guardrails | Integrations | Ease | Perf/Cost | Security/Admin | Support | Weighted Total |
|---|---|---|---|---|---|---|---|---|---|
| Datadog Bits AI | 9.3 | 8.9 | 8.6 | 9.2 | 8.5 | 7.5 | 8.7 | 8.8 | 8.8 |
| Dynatrace Davis AI | 9.4 | 9.2 | 8.9 | 8.8 | 7.8 | 7.2 | 9.0 | 8.8 | 8.8 |
| New Relic Grok | 8.8 | 8.5 | 8.0 | 8.5 | 8.8 | 8.0 | 8.2 | 8.4 | 8.5 |
| Grafana Assistant | 8.6 | 8.2 | 7.8 | 9.0 | 8.6 | 8.8 | 7.8 | 8.2 | 8.5 |
| Splunk AI Assistant | 9.0 | 8.8 | 8.8 | 8.5 | 7.5 | 7.0 | 9.0 | 8.8 | 8.5 |
| Elastic AI Assistant | 8.5 | 8.2 | 8.0 | 8.5 | 8.0 | 8.0 | 8.2 | 8.0 | 8.3 |
| Chronosphere AI | 8.4 | 8.0 | 8.2 | 8.2 | 8.0 | 8.8 | 8.4 | 8.0 | 8.3 |
| Honeycomb AI | 8.7 | 8.4 | 7.8 | 8.4 | 8.5 | 8.2 | 7.8 | 8.2 | 8.4 |
| OpenObserve AI | 8.2 | 7.8 | 7.5 | 8.0 | 8.2 | 9.2 | 7.5 | 7.8 | 8.2 |
| Microsoft Copilot for Azure | 8.8 | 8.4 | 8.8 | 8.5 | 8.2 | 7.8 | 9.0 | 8.5 | 8.5 |
Top 3 for Enterprise
1- Dynatrace Davis AI
2- Datadog Bits AI
3- Splunk AI Assistant
Top 3 for SMB
1- Grafana Assistant
2- New Relic Grok
3- OpenObserve AI
Top 3 for Developers
1- Grafana Assistant
2- Honeycomb AI
3- New Relic Grok
Which AI Observability Copilot Is Right for You
Solo / Freelancer
Small engineering teams benefit most from lightweight and flexible observability workflows. Grafana Assistant and OpenObserve AI are practical because they reduce cost and operational complexity while remaining flexible.
SMB
SMBs should prioritize observability simplicity, Kubernetes support, conversational troubleshooting, and telemetry cost management. New Relic Grok, Grafana Assistant, and OpenObserve AI provide strong balance between usability and operational visibility.
Mid-Market
Mid-market organizations should focus on governance, cloud-native scalability, telemetry correlation, and operational automation. Datadog Bits AI, Dynatrace Davis AI, and Chronosphere AI are especially useful for scaling observability maturity.
Enterprise
Enterprises should prioritize operational governance, auditability, RBAC, AI Ops workflows, multi-cloud compatibility, and autonomous troubleshooting capabilities. Dynatrace Davis AI, Splunk AI Assistant, and Datadog Bits AI are particularly strong enterprise-ready platforms.
Regulated Industries
Finance, healthcare, insurance, and public sector organizations should validate operational governance, telemetry retention, RBAC, auditability, AI explainability, and deployment controls carefully before large-scale adoption.
Budget vs Premium
Budget-focused organizations can begin with Grafana Assistant or OpenObserve AI. Premium enterprise platforms become valuable when organizations require autonomous analysis, AI Ops automation, advanced governance, and enterprise-scale operational intelligence.
Build vs Buy
Organizations with advanced platform engineering maturity can build internal observability copilots using OpenTelemetry pipelines and AI APIs. Most organizations benefit from buying because telemetry correlation, AI Ops workflows, governance, and operational intelligence are difficult to maintain internally.
Implementation Playbook 30 / 60 / 90 Days
First 30 Days
- Identify high-noise observability workflows
- Select pilot troubleshooting scenarios
- Integrate telemetry sources and OpenTelemetry pipelines
- Configure RBAC and operational permissions
- Test AI-generated operational summaries
- Validate Kubernetes and cloud integrations
- Establish incident review standards
- Create governance workflows
Days 30–60
- Expand AI-assisted troubleshooting workflows
- Add deployment impact analysis
- Improve telemetry quality and metadata hygiene
- Train SRE and DevOps teams
- Introduce operational analytics workflows
- Optimize alert prioritization
- Add ChatOps integrations
- Standardize observability review procedures
Days 60–90
- Scale observability copilots organization-wide
- Add advanced AI Ops automation
- Optimize telemetry cost governance
- Expand cloud-native operational workflows
- Audit AI-generated remediation guidance
- Improve governance and auditability
- Standardize operational AI policies
- Build long-term observability maturity plans
Common Mistakes & How to Avoid Them
- Trusting AI-generated remediation without validation
- Ignoring telemetry quality and instrumentation hygiene
- Over-collecting observability data unnecessarily
- Neglecting telemetry cost governance
- Failing to validate AI-generated root causes
- Ignoring RBAC and operational governance
- Using incomplete OpenTelemetry instrumentation
- Over-automating production workflows
- Failing to review deployment context
- Ignoring Kubernetes metadata quality
- Creating vendor lock-in around observability pipelines
- Not training teams on AI-assisted troubleshooting
- Neglecting auditability and operational review
- Treating observability as dashboards only
FAQs
1. What are AI Observability Copilots?
These platforms help engineering and SRE teams investigate incidents, correlate telemetry, summarize operational data, and troubleshoot infrastructure using AI-assisted workflows.
2. How are observability copilots different from monitoring tools?
Traditional monitoring focuses on predefined alerts and dashboards, while observability copilots help engineers understand why issues occur using AI-driven telemetry analysis.
3. Which tool is best for enterprise observability?
Dynatrace Davis AI and Datadog Bits AI are particularly strong for enterprise-scale observability and AI Ops workflows.
4. Which platform is best for open-source observability?
Grafana Assistant and OpenObserve AI are excellent choices for open-source and OpenTelemetry-native environments.
5. Can these tools troubleshoot Kubernetes issues?
Yes. Many observability copilots provide Kubernetes-aware troubleshooting workflows and telemetry correlation.
6. Are these tools replacing SRE engineers?
No. They reduce operational complexity and repetitive analysis but still require engineering oversight and operational expertise.
7. What is the biggest risk?
The biggest risk is relying on AI-generated analysis without validating telemetry quality, deployment context, and operational governance.
8. How important is OpenTelemetry support?
OpenTelemetry support is increasingly critical because it improves portability, vendor flexibility, and telemetry standardization.
9. Can these platforms monitor AI workloads?
Yes. Many observability platforms are adding AI workload and LLM observability support.
10. Are observability costs becoming a major concern?
Yes. Telemetry ingestion costs are increasingly important, especially in Kubernetes and AI-heavy environments.
11. Can these tools integrate with ChatOps systems?
Yes. Many observability copilots integrate with Slack, Teams, and incident response workflows.
12. How should organizations begin adoption?
Start with incident summarization and low-risk troubleshooting workflows, improve telemetry quality, validate AI-generated insights carefully, and scale gradually.
Conclusion
AI Observability Copilots are rapidly transforming how organizations monitor, troubleshoot, and optimize modern distributed systems. As cloud-native environments, AI workloads, Kubernetes operations, and multi-cloud infrastructure become increasingly complex, engineering teams need more than dashboards and alerts. They need systems that can correlate telemetry automatically, explain incidents conversationally, reduce operational noise, and accelerate root cause analysis using AI-assisted operational intelligence.Datadog Bits AI and Dynatrace Davis AI remain strong leaders for enterprise-scale observability and AI Ops workflows, while Grafana Assistant and OpenObserve AI provide compelling open observability alternatives. New Relic Grok and Honeycomb AI are especially useful for conversational troubleshooting and distributed tracing workflows, and Splunk AI Assistant continues to excel in enterprise operational analytics.The best platform depends on your telemetry maturity, operational governance requirements, cloud-native architecture complexity, and observability strategy. Start by improving telemetry quality and OpenTelemetry adoption, run controlled pilots with human review workflows, validate AI-generated operational guidance carefully, and gradually expand AI-assisted observability across your infrastructure and engineering teams.
Find Trusted Cardiac Hospitals
Compare heart hospitals by city and services — all in one place.
Explore Hospitals
A great overview of AI observability copilots that clearly explains how these tools help teams improve monitoring, troubleshooting, and operational efficiency in modern IT environments.