There are 2 default template has been given by Zabbix which can be used to Apache HTTP metrices monitoring
- Apache by HTTP
- Apache by Zabbix agent
Zabbix Template – Apache by HTTP
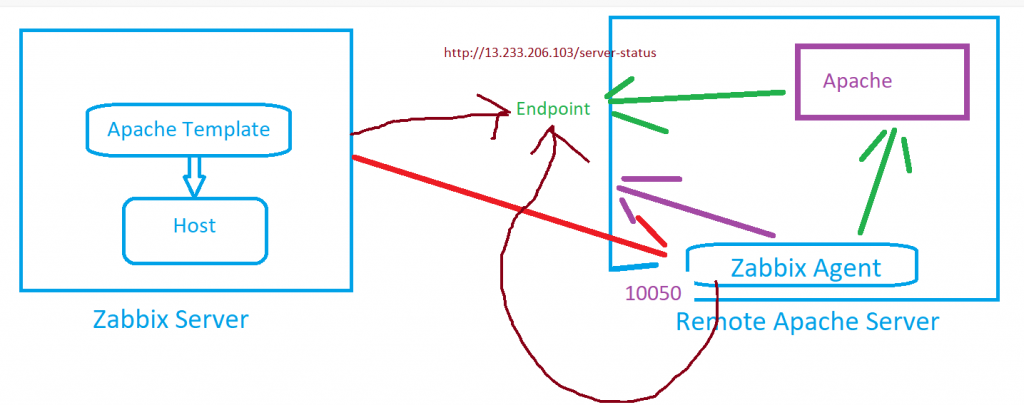
For Zabbix version: 6.0 and higher. The template to monitor Apache HTTPD by Zabbix that work without any external scripts. Most of the metrics are collected in one go, thanks to Zabbix bulk data collection. Template Apache by HTTP – collects metrics by polling mod_status with HTTP agent remotely.
Details – https://www.zabbix.com/integrations/apache#apache_http
Zabbix Template – Apache by Zabbix agent
For Zabbix version: 6.0 and higher. The template to monitor Apache HTTPD by Zabbix that work without any external scripts. Most of the metrics are collected in one go, thanks to Zabbix bulk data collection. Template Apache by Zabbix agent – collects metrics by polling mod_status locally with Zabbix agent. It also uses Zabbix agent to collect Apache Linux process stats like CPU usage, memory usage and whether process is running or not.
Details – https://www.zabbix.com/integrations/apache#apache_agent
Step 1 – Install Apache HTTP
Step 2 – Enable mod_status in Apache HTTP
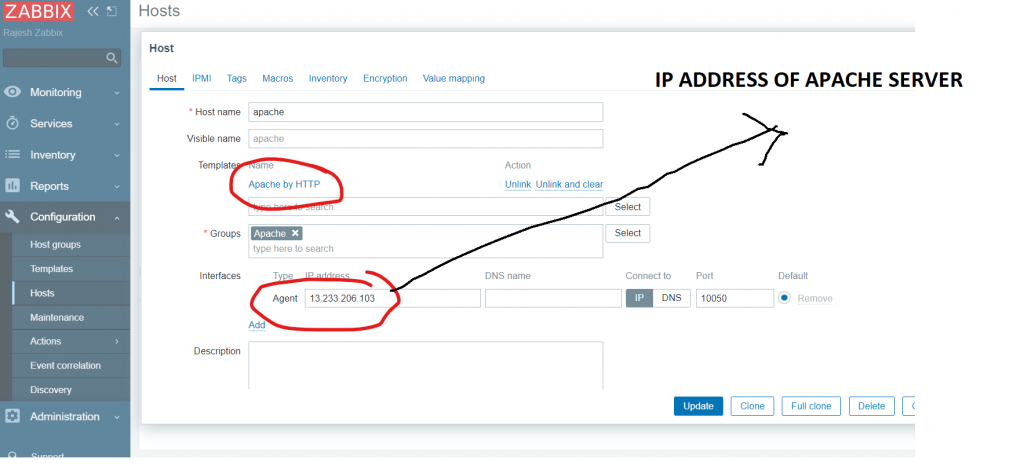
Step 3 – Create a Zabbix host for apache and use Zabbix Template “Apache by HTTP”
Note – This does not require any additional in the host of Apache HTTP server.
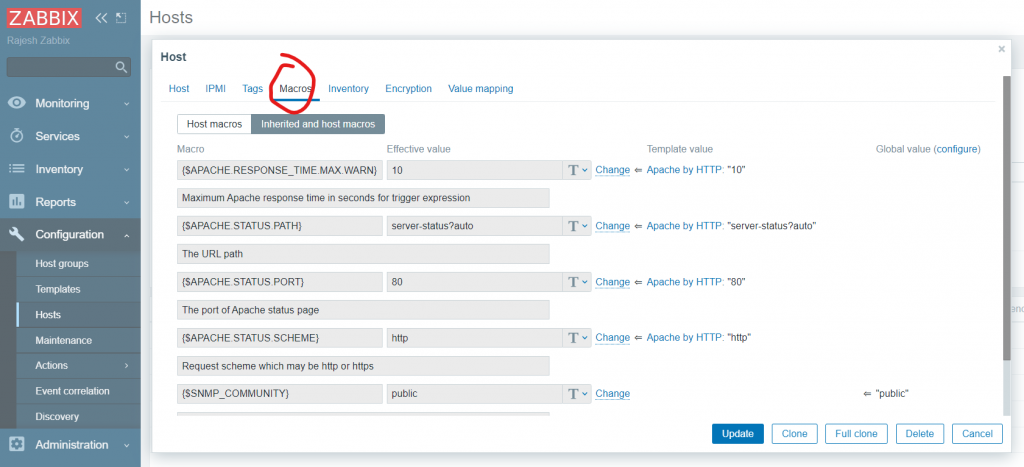
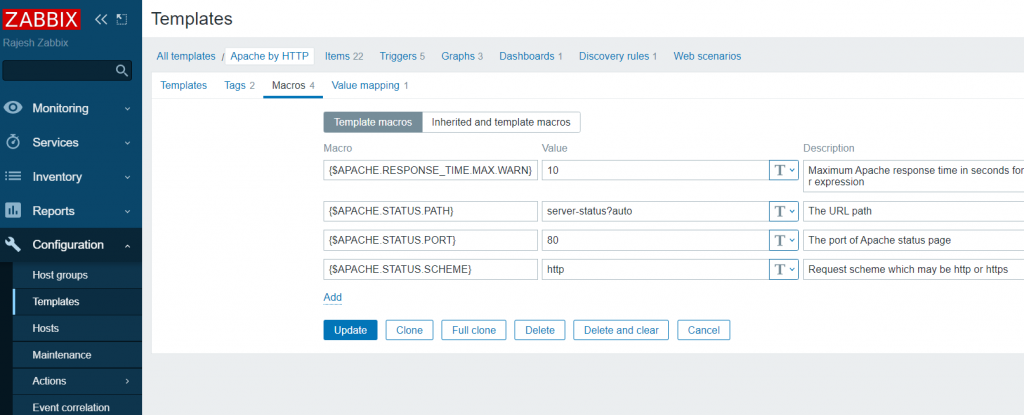
Step 4 – Validate all the values in the Zabbix Host Macros of Apache HTTP
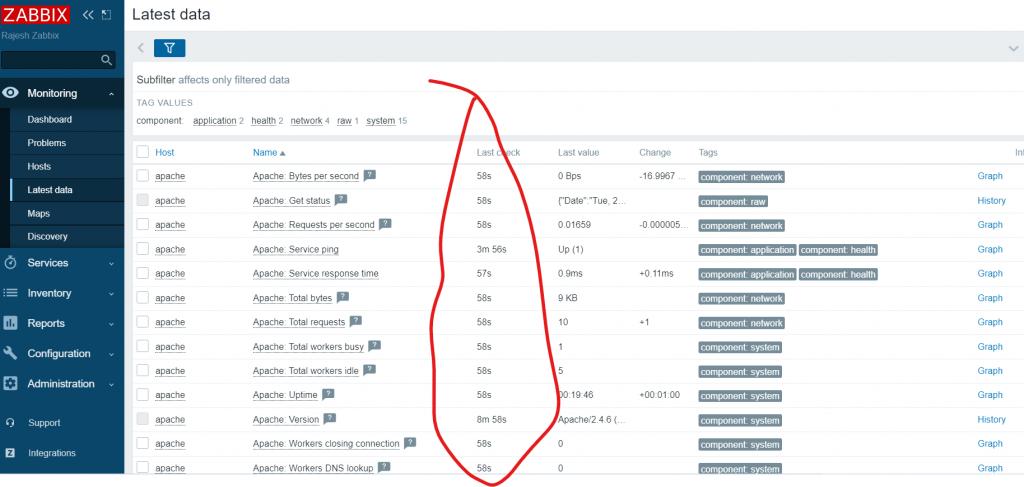
Step 5 – Validate all the Apache Metrices in Latest Data
I’m Rajesh Kumar, a DevOps, SRE, DevSecOps, Cloud, and Platform Engineering expert passionate about sharing practical knowledge, real-world experiences, and industry best practices. I have worked at Cotocus and regularly write about technology, travel, investing, health, product reviews, and digital marketing through my various platforms.
I publish technical articles at DevOps School, travel stories at Holiday Landmark, stock market insights at Stocks Mantra, health and fitness guidance at My Medic Plus, product reviews at TrueReviewNow, and SEO and digital marketing strategies at Wizbrand.
Find Trusted Cardiac Hospitals
Compare heart hospitals by city and services — all in one place.
Explore Hospitals